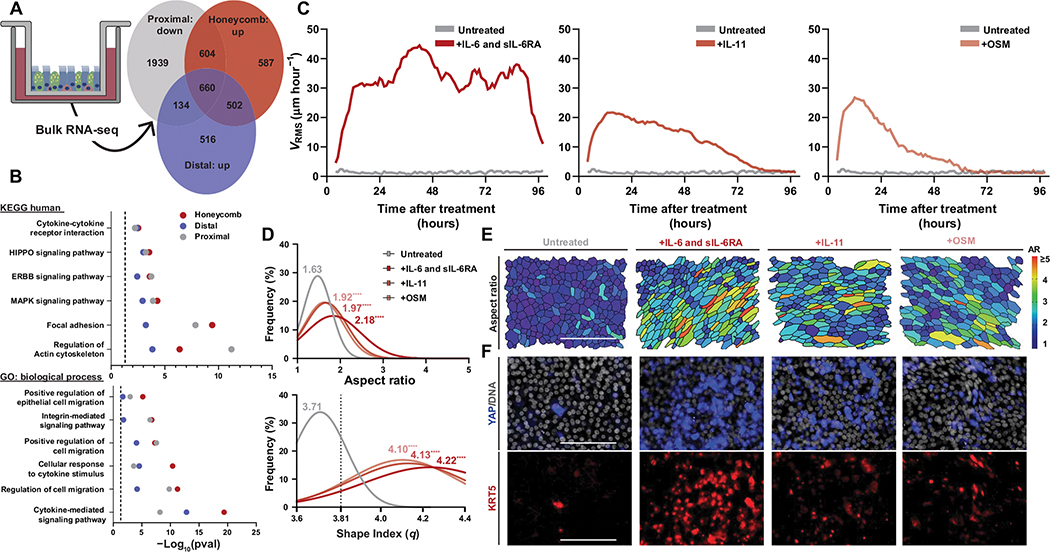
Fig. 2. Activation of IL-6 family signaling drives epithelial fluidization.
(A) Venn diagram of genes down-regulated in proximal cultures between day 0 and 14 of air-liquid interface (ALI) compared with those up-regulated in distal and honeycomb cultures at day 14 of ALI. (B) Kyoto Encyclopedia of Genes and Genomes (KEGG) and gene ontology (GO) analysis of the shared 660 differentially regulated genes from (A). (C) Mean root-mean-squared velocity (VRMS) of IL-6 family cytokine–stimulated cultures over the course of 96 hours after their initial treatment. Treatments shown are IL-6 and soluble IL-6 receptor (IL-6 and sIL-6RA), IL-11, and oncostatin-M (OSM). (D) Histogram of cellular aspect ratio (AR) and shape index (q) with mean values from IL-6 family cytokine–stimulated cultures at 24 hours after initial stimulation with statistical comparisons to untreated proximal cultures. Dashed line represents shape index of 3.81, the theoretical threshold between fluid and solid phases. One-way ANOVA was used for statistical comparison. (E) Representative images of segmented cultures 24 hours after stimulation with IL-6 family cytokines color-coded on the basis of cell AR. Scale bar, 100 μm. (F) Representative images of YAP- and KRT5-stained cultures after IL-6 family cytokine stimulation. Scale bars, 100 μm. (A to F) For all statistical analysis, ****P < 0.0001. Epithelial culture experiments were independently performed N ≥ 3 times with n ≥ 4 donors.

