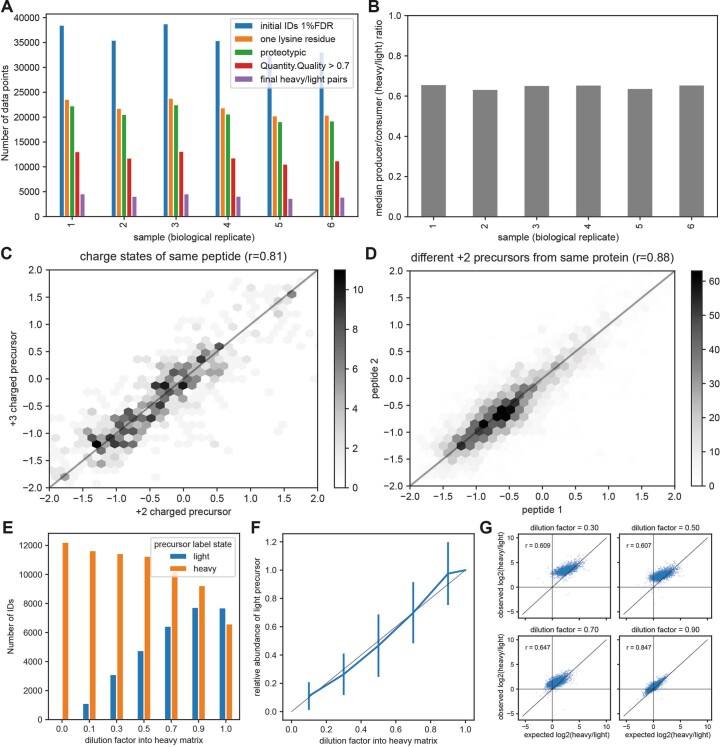
Extended Data Fig. 4. Proteome-wide deconvolution of producer and consumer proteomes by DIA-PASEF (Dataset 3).
a, Number of precursor IDs across samples. The progressive filters which were applied are shown in different colours. b, The median ratio of producer to consumer (heavy to light) peptides was highly consistent across biological replicates. c, After suitable quality filters were applied (in particular: Quantity.Quality > 0.7), log2-transformed labelling ratios between +2 and +3 charge states of the same peptide correlated tightly (Pearson r = 0.81). (D) Similarly, log2-transformed labelling ratios of different proteotypic, tryptic peptides from the same protein correlated tightly (Pearson r = 0.88). This analysis was restricted to +2 charged precursors, identified across all samples. In cases where more than two precursors were found for a protein, an arbitrary pair was selected. e, To further test the robustness of the analytical approach, a pooled sample was mixed with fully ¹³C-labelled peptides at different ratios. Identical quality filters were applied as before. The number of light precursors (¹²C-lysine) identified decreases with dilution and virtually no light peptides are wrongly identified in the fully labelled matrix. f, Detected abundances of light peptides (relative to abundance in undiluted sample) behave proportionally to the dilution factor. Error bars show median absolute deviation across all peptides identified in the sample. g, The original labelling ratios can be recovered with reasonable accuracy (the Pearson correlation coefficient is shown) even upon three-fold dilution into heavy matrix although at low dilutions there is a tendency to overestimate ratios and the observed ratios show a lower degree of variance (compression of ratios) compared to what is expected.

