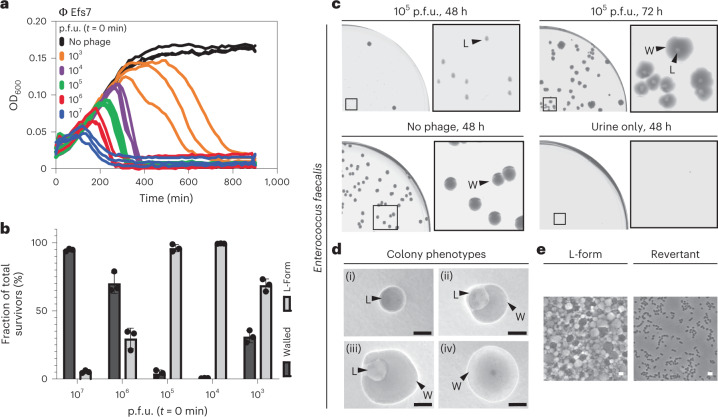
Fig. 6. Phage-induced E. faecalis L-form conversion in human urine.
a–c, Phage Efs7 infection of E. faecalis in human urine triggers L-form generation. a, Growth curves in human urine for E. faecalis. Bacteria were challenged with serial dilutions of phage (107, 106, 105, 104, 103 p.f.u.) or no phage at t = 0 min. As a control, sterile-filtered urine was incubated without bacteria (shown in c only). For each condition, three independent replicates are presented as individual curves. b,c, Relative quantification of L-form survival after phage infection. Cultures from a were plated 15 h after infection on DM3 supplemented with cysteine. Populations of L-forms and walled survivors are normalized to the total c.f.u. per infection. Quantification was performed at 48 h after streaking. Data are mean ± s.d. of three independent experiments (n = 3). c–e, Effect of phage infection in human urine on L-form emergence and reversion. c, Representative high-resolution plate scans obtained from b. Top panel shows identical streaks of E. faecalis at 48 h and 72 h after Efs7 infection with 105 p.f.u. Note that after 48 h, all colonies show the L-form phenotype (L), followed by reversion back to the walled state (W) after 72 h. Bottom panels show controls of E. faecalis with no phage or sterile-filtered urine only after 48 h incubation. d,e, Individual colony phenotypes observed in c. Micrographs show E. faecalis L-form colonies (i), intermediate states of reversion (ii,iii) and walled cells (iv). Corresponding PC micrographs show cell morphology. The figures are representative of at least three independent experiments. Scale bars, 0.5 mm (d), 2 µm (e).

