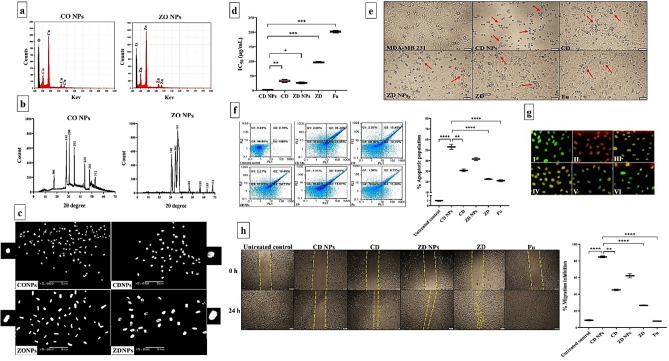
Figure 1.
Characterization of the prepared NPs and anticancer impact on MDA-MB 231 cells. (a) Elemental charts of Cu and O in copper oxide (CO) NPs as well as Zn and O in zinc oxide (ZO) NPs using energy dispersive X-ray analysis (EDX). (b) X-ray diffractometer (XRD) patterns for CO NPs and ZO NPs. (c) scanning electron microscope images of CO NPs and ZO NPs as well as their corresponding nanocomplexes with diethyldithiocarbamate (CD NPs and ZD NPs, respectively) at magnification, × 5000; scale bar, 5 µm. For more declaration, individual nanoparticle of each prepared type was showed at maximum magnification. (d) MTT results in the term of IC50 values of CD NPs, CD, ZD NPs, ZD, and 5-fluorouracil (Fu) with (e) morphological alterations of these treated MDA-MB 231 cells (Red arrows refer to apoptotic cells) compared to the untreated control cells. (Magnification, × 100; scale bar, 50 µm). (f) Apoptotic activity as illustrated by flow cytometry dot plots of the untreated MDA-MB 231 and CD NPs-, CD-, ZD NPs-, ZD-, and Fu-treated cells with the total percentage of apoptosis after staining with annexin V/propidium iodide as well as (g) fluorescence microscopic images for the untreated and treated MDA-MB 231 after incubation with acridine orange and ethidium bromide (Green, yellow and orange-red fluorescence reflect healthy, early apoptotic, and late apoptotic cell population, respectively) (Magnification, × 100; scale bar, 50 µm). (h) Anti-migration activity as showed by microscopic pictures of the wound area (yellow dashed line-labeled) in the untreated and treated MDA-MB 231 cells at 0 and 24 h (Magnification, × 40; scale bar, 200 µm) with the percentage of migration inhibition. Data are demonstrated as mean ± SEM. CD NPs were compared to other tested compounds, considering significantly different at p < 0.05*, < 0.01**, and < 0.001***.

