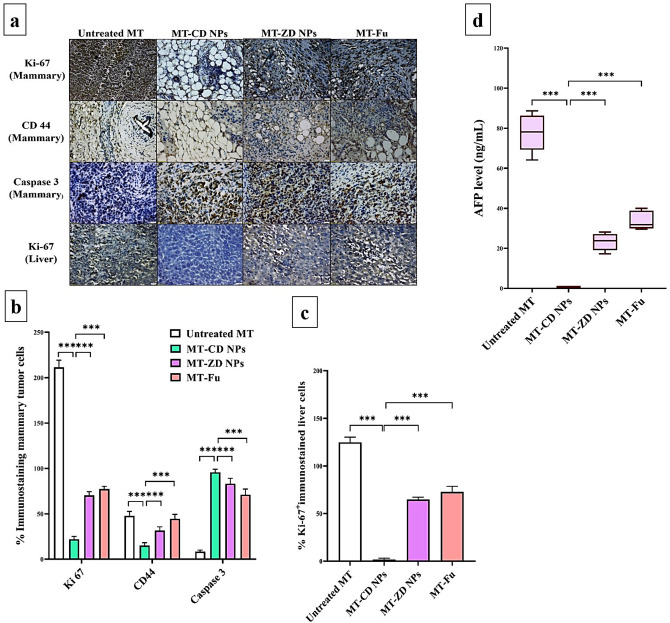
Figure 5.
Immunohistochemical analysis and biochemical detection of anti-metastatic tumor potential. (a) Microscopic images of Ki-67, CD44, and caspase 3-immunostained mammary tumor as well as Ki-67-immunostained liver sections of the untreated mammary tumor-bearing mouse group (MT), CD NPs-treated MT group (MT-CD NPs), MT-ZD NPs group, and MT-Fu group with (b,c) their percentages of positive immunostained tumor cells. (d) The blood level (ng/mL) of α-fetoprotein (AFP). All values are demonstrated as mean ± SEM. MT-CD NPs group was compared to other groups, considering significantly different at p < 0.05*, < 0.01**, and < 0.001***.

