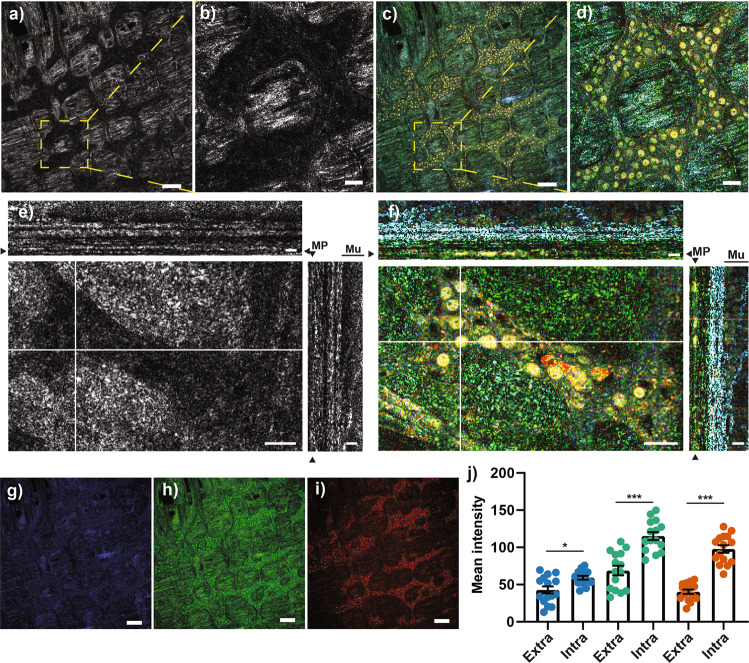
Fig. 2. Comparison of FFOCT and D-FFOCT imaging of the myenteric plexus in the mouse colon.
a–d Micrograph of the myenteric plexus region in FFOCT (a, b) or D-FFOCT (c, d). b and d represent an enlargement of the dotted area in (a) and (c), respectively. e, f Orthogonal view of different planes (x/y; x/z and y/z) of FFOCT (e) and D-FFOCT (f) z-stack images (60 images). Arrows head point out the position of “en face image” in the orthogonal view. g–i The D-FFOCT micrograph in (c) is a RGB-coded image in which the blue channel (g) represents the low frequencies [0–0.6 hertz], the green channel (h) corresponds to medium frequencies [0.6–5.4 hertz] and the red channel (i) to high frequencies [5.4–25 hertz]. j The mean intensity of low (blue), medium (bluish green), or high (vermillion) frequencies was determined in intra- and extra-ganglionic regions of the myenteric plexus. Three animals were used to determine the mean intensity +/− SEM and five independent regions were analyzed per animal. Statistic: two-tailed Mann and Whitney t-test. *p < 0.05; ***p < 0.001. Scale bar: a, c, g–i, 125 µm; b, d, 30 µm; e–f, x/y 30 µm, x/z and y/z 12 µm. MP myenteric plexus, Mu mucosa.

