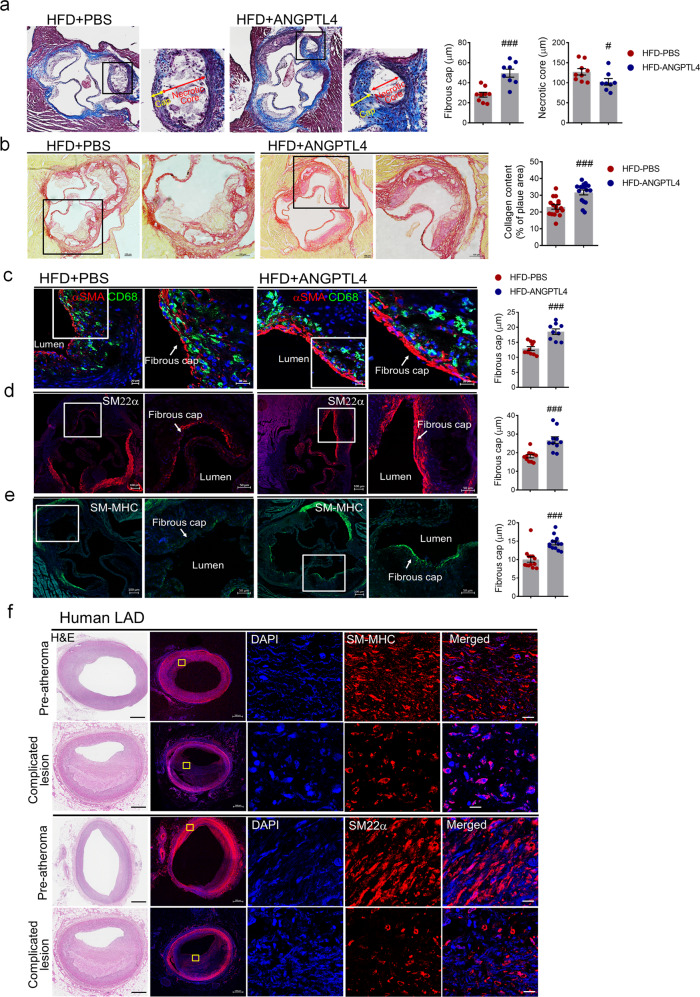
Fig. 4. Effects of ANGPTL4 on the stability of atherosclerotic plaques.
a–e Representative histologic analysis of the aortic root from the PBS and ANGPTL4 groups. a Representative images of Masson trichrome staining are shown. Boxed areas in the aortic root depict the fibrous cap and necrotic core at higher magnification, and the fibrous cap and necrotic core were measured as the lesion thickness. Scale bar, 100 μm. b Representative images of picrosirius red staining for collagen, and quantification of the collagen content presented as a percentage of the plaque area. Scale bar, 100 μm. Immunofluorescence staining of atherosclerotic plaques showed α-SMA and CD68 (c), SM22α (d), and SM-MHC (e) in the fibrous caps. Quantification of the fibrous cap thickness is presented in the right panels. Scale bar, 20 μm. f H&E (left panels) and SM-MHC and SM22α-stained confocal images of lesions representing preatheromatous plaques and complicated lesions of the human LAD. Scale bar, 10 μm. Data were presented as the mean ± SEM. #p < 0.05, ###p < 0.001 (by Student’s t-test). LAD left anterior descending artery.

