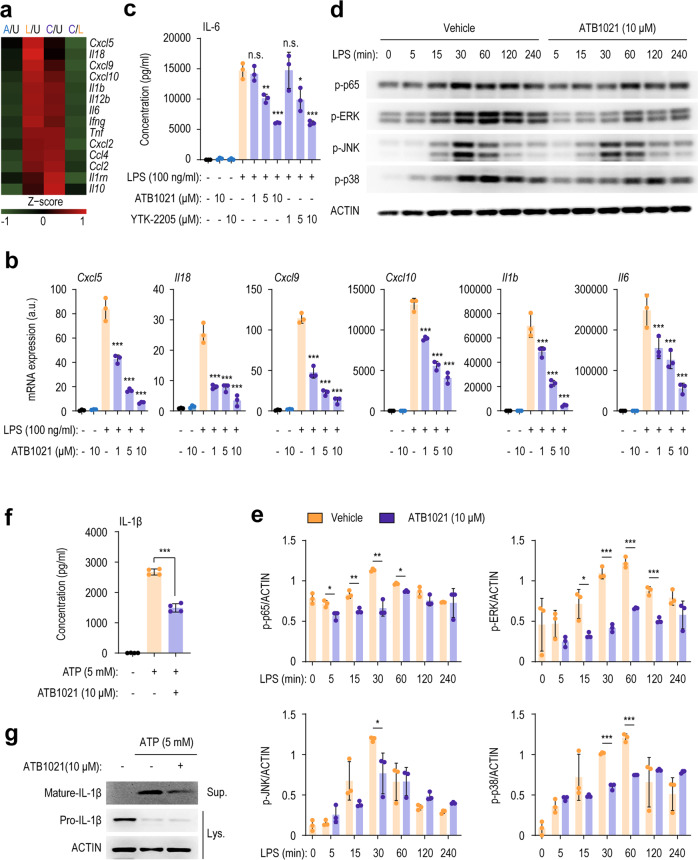
Fig. 2. p62 ligands inhibit LPS-induced proinflammatory cytokine production and inflammasome activation.
a Heatmap of differentially expressed genes in LPS-stimulated macrophages in the presence or absence of ATB1021 (10 μM). Z scores were calculated using the mean values of biological replicates. A/U, ATB1021 relative to unstimulated; L/U, LPS relative to unstimulated; C/U, ATB1021 plus LPS relative to unstimulated; C/L, ATB1021 plus LPS relative to the LPS stimulated group. b mRNA levels of Cxcl5, Il18, Cxcl9, Cxcl10, Il1b, and Il6 in PMs pretreated with ATB1021 (1, 5, or 10 μM) for 1 h and stimulated with LPS (100 ng/mL) for 6 h (n = 3). c ELISA of supernatant collected 18 h after LPS (100 ng/mL) stimulation of PMs treated with ATB1021 or YTK-2205 (1, 5, or 10 μM) (n = 3). d, e PMs pretreated with ATB1021 (10 μM) were stimulated with LPS (100 ng/mL) for the indicated times to assess the phosphorylation of NF-κB and the MAPKs ERK, JNK, and p38. e Densitometry analysis of the indicated proteins (n = 3). f, g IL-1β levels in the culture supernatants of PMs primed with LPS (100 ng/mL) and stimulated with ATP (5 mM) in the presence or absence of ATB1021 (10 μM) (as determined by ELISA; f, n = 4) or in the supernatant and cell lysate (as determined by Western blotting; g) for mature or precursor IL-1β. Means ± SD are shown (b, c, e, f). One-way ANOVA with Tukey’s multiple comparison test (b, c) or two-tailed Student’s t test (c, f) was used to determine statistical significance. *p < 0.05, **p < 0.01, ***p < 0.001.

