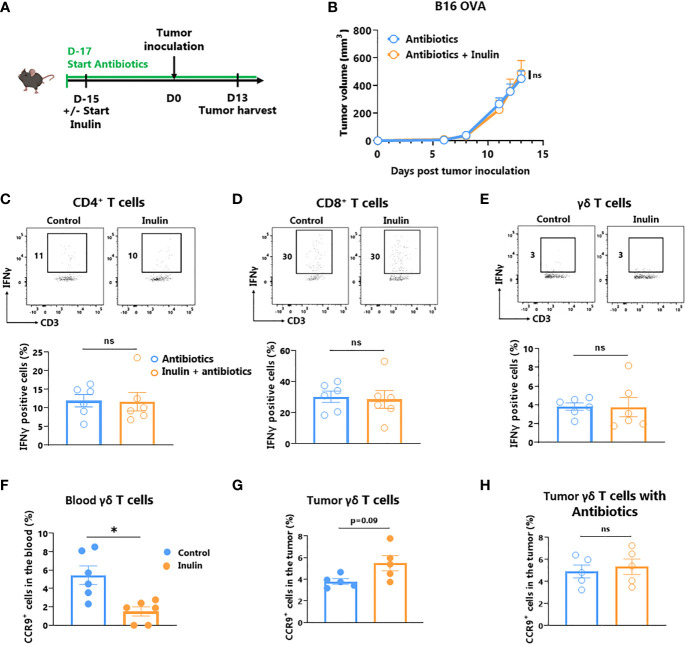
Figure 5.
Inulin-triggered anti-tumor effect relies on intact bacterial gut microbiota. (A) Experimental schedule. C57BL/6 mice were fed with a control diet or inulin-enriched diet (7.2% in drinking water) (n=6 mice per group) starting 15 days before s.c. inoculation of 2x10⁵ B16 OVA melanoma cells. Microbial gut microbiota was depleted from 2 days before the beginning of the diet by adding vancomycin (0.25 g/L), colimycin (12x106 U/L), ampicillin (1 g/L) and streptomycin (5 g/L) to drinking water. (B) Tumor growth curves of mice treated as described in (A). (C–E) Frequency of B16 OVA tumor-infiltrated IFNγ-producing cells gated on CD45+ CD3+ γδ TcR- CD4+, defined as CD4+ T cells (C), CD45+ CD3+ γδ TcR- CD4-, defined as CD8+ T cells (D) or CD45+ CD3+ γδ TcR+, defined as γδ T cells (E) from mice treated as described in (A). (F, G) Frequency of CCR9+ cells among CD45+ CD3+ γδ TcR+ in (F) the blood and in (G) the tumor of mice fed with a control diet or inulin-enriched diet (7.2% in drinking water) (n=6 mice per group) starting 15 days before s.c. inoculation of B16 OVA melanoma cells. (H) Frequency of CCR9+ cells among CD45+ CD3+ γδ TcR+ in tumor of mice treated as described in (A). Graphs show the mean ± SEM. ns = not-significant, *p < 0.05 by two-way ANOVA with Geisser greenhouse’s correction (B) or by Mann-Whitney tests (C–H).

