FIGURE 2.
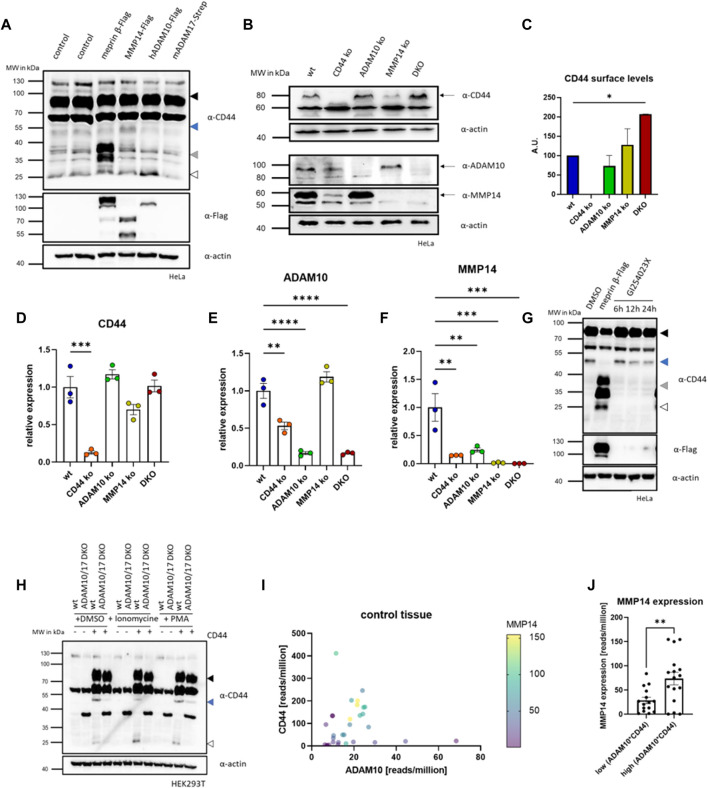
CRISPR/Cas9 of CD44 and shedding enzymes. (A) Western blot of HeLa cells expressing different CD44 cleaving proteases. Arrows indicate different membrane associated CD44 cleavage fragments (black = full-length CD44, blue = 50 kDa CD44, grey = 37 kDa fragment, white = 25 kDa CTF). (B) Western blot of different CRISPR/Cas9 generated HeLa cell lines deficient for CD44 (CD44 ko), ADAM10 (ADAM10 ko), MMMP14 (MMP14 ko) and ADAM10 and MMP14 (DKO). (C) FACS analysis of CD44 cell surface levels (n = 3, values with SEM, one-way ANOVA). (D) Transcriptional level of CD44 determined by qRT-PCR in the different CRISPR/Cas9 generated cell lines (n = 3, values with SEM, one-way ANOVA). (E) Transcriptional level of ADAM10 determined by qRT-PCR in the different CRISPR/Cas9 generated cell lines (n = 3, values with SEM, one-way ANOVA). (F) Transcriptional level of MMP14 determined by qRT-PCR in the different CRISPR/Cas9 generated cell lines (n = 3, values with SEM, one-way ANOVA). (G) Western blot of HeLa cell lysates against CD44 in cells expressing meprin β or incubated with the ADAM10 inhibitor GI254023X for different time periods (arrows as in a). (H) Western blot of HEK293T wt and ADAM10 and ADAM17 double deficient (DKO ADAM10/17) HEK293T cells against CD44. Cells were transfected with CD44 and additionally cleavage of CD44 was induced by stimulation of endogenous ADAM10 (Ionomycine) or ADAM17 (PMA). (I) Analysis of GTEx (gene tissue expression) data derived from the Gepia2 server. Expression values are plotted against CD44 (y-axis) and ADAM10 (x-axis). Expression levels of MMP14 are shown from purple (low expression) to yellow (high expression). (J) GTEx data for CD44 and ADAM10 was multiplied and samples were sorted into upper and lower median. MMP14 expression in the upper median is significantly higher than in the lower median (n = 15 (lower median) and n = 16 (upper median), values shown as mean with SEM, unpaired Student’s t-test). *p < 0.05, **p < 0.01, ***p < 0.001 ****p < 0.0001.

