FIGURE 3.
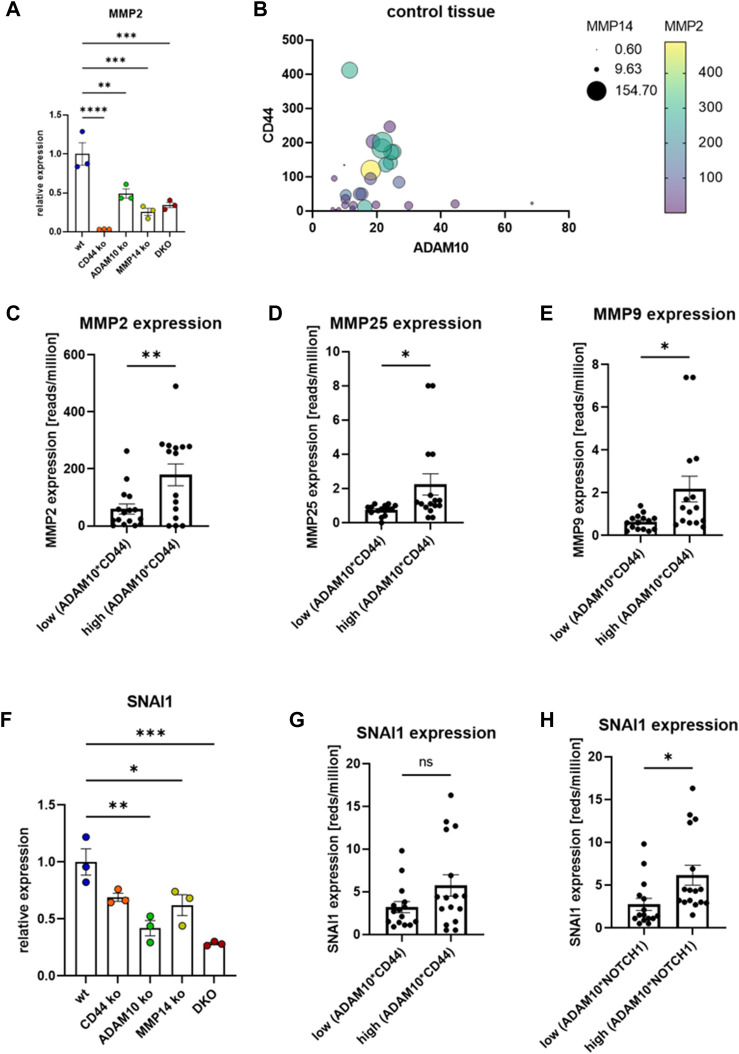
Transcriptional regulation of selected MMPs. (A) Transcriptional regulation of MMP2 in different CRISPR/Cas9 generated cell lines (n = 3, values are shown with SEM, one-way ANOVA). (B) Transcriptional regulation of MMP2 in dependency of CD44, ADAM10 and MMP14 analyzed in GTEx data. (C) Transcriptional regulation of MMP2 in dependency of ADAM10 and CD44 (n = 15 (lower median) and n = 16 (upper median), values shown as mean with SEM, unpaired Student’s t-test). (D) Transcriptional regulation of MMP25 in dependency of ADAM10 and CD44 (n = 15 (lower median) and n = 16 (upper median), values shown as mean with SEM, unpaired Student’s t-test). (E) Transcriptional regulation of MMP9 in dependency of ADAM10 and CD44 (n = 15 (lower median) and n = 16 (upper median), values shown as mean with SEM, unpaired Student’s t-test). (F) The expression of SNAI1 is significantly reduced in cells deficient for MMP14, ADAM10 or both proteases (n = 3, values are shown with SEM, one-way ANOVA). (G) The expression of SNAI1 does not depend on the expression of ADAM10/CD44 (n = 15 (lower median) and n = 16 (upper median), values shown as mean with SEM, unpaired Student’s t-test). (H) The expression of SNAI1 differs significantly when sorted by the expression level of ADAM10*NOTCH1 (n = 15 (lower median) and n = 16 (upper median), values shown as mean with SEM, unpaired Student’s t-test). *p < 0.05, **p < 0.01, ***p < 0.001 ****p < 0.0001.

