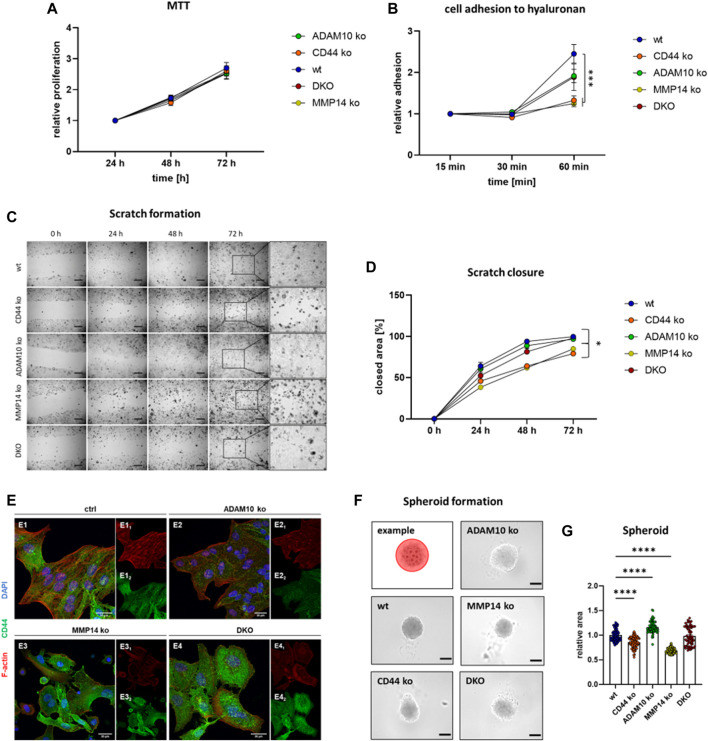
FIGURE 4.
Functional consequences for loss of CD44 or its shedding enzymes. (A) Cell viability/proliferation determined with an MTT assay reveals no difference between the different cell lines (n = 15 for wt, CD44 ko, ADAM10 ko and MMP14 ko, n = 8 for DKO, values shown with SEM, two-way ANOVA). (B) Cell adhesion to hyaluronan as determined utilizing a plate and wash assay (n = 9, values shown with SEM, two-way ANOVA, complete statistical analysis in Supplementary Table S1). (C) Closure of a previously applied scratch was determined at 24, 48, and 72 h. Inserts (at right) show magnification of the previous scratch area at 72 h (D) Quantification of the scratch assay shown in (C) (n = 11, values shown with SEM, two-way ANOVA, complete statistical analysis in Supplementary Table S2). (E) Immunofluorescence microscopy against CD44 (green) and F-actin (Phalloidine, red) and the nucleus (blue). (F) Tumor spheroid formation assay with an exemplary cartoon showing how the spheroid area was determined (upper left corner). (G) Quantification of individual tumor spheroid areas (n = 62–77, individual values shown as mean with SEM, one-way ANOVA, ****p < 0.0001).

