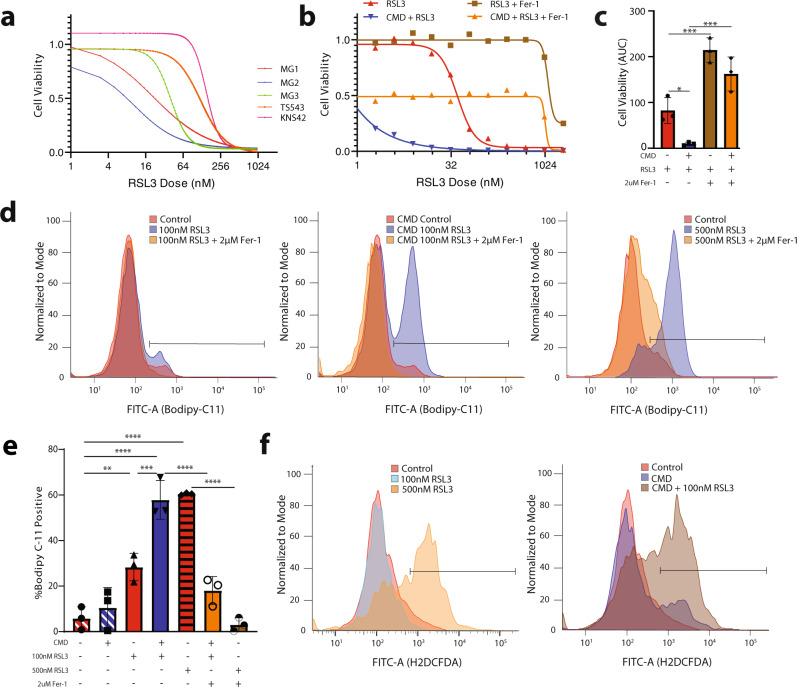
Fig. 1. Cysteine and methionine deprivation (CMD) sensitizes glioma to RSL3-induced ferroptosis.
a 384-well dose-response curves showing response to RSL3 from 5 glioma cell lines: MG1, MG2, MG3, TS543, and KNS42. b Representative 384-well dose-response showing MG3 cells treated with RSL3 (red), RSL3 plus 2 uM Ferrostatin-1 (brown), CMD plus RSL3 (blue), CMD plus RSL3 and 2 uM Ferrostatin-1 (orange). c AUC quantification for dose response curves from 3-independent 96-well dose response curves of MG3 murine glioma cell lines treated with RSL3 ± CMD ± 2 uM Ferrostatin-1. d Representative Bodipy-C11 flow data from MG1 cells: left panel shows DMSO control (red), 100 nM RSL3 (blue), and 100 nM RSL3 plus 2 uM Ferrostatin-1 (orange) treatment for 30 min. Middle panel shows the same conditions but with 6 h of cysteine methionine deprivation pretreatment. Right panel shows a higher dose of RSL3 treatment (500 nM). e Quantification of 3 independent experiments demonstrated in d. f Flow cytometry, using H2DCFDA of ex vivo organotypic slice cultures from a human primary glioblastoma (CUMC TumorBank 6193) cultured in control or CMD media and treated with RSL3. Data for c and e are presented as mean ± SD. Significance denoted by: *p < 0.05, **p < 0.01, ***p < 0.001.

