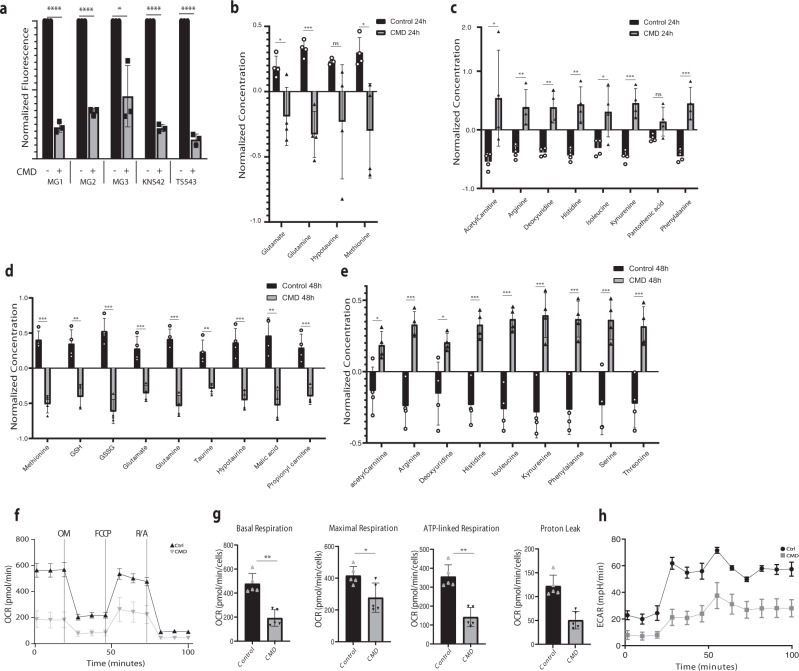
Fig. 3. CMD alters glioma cell metabolism.
Metabolite profiling performed on in vitro cell lines (a) Colorimetric assay of reduced glutathione levels for (left to right) MG1 (p < 0.001), MG2 (p < 0.001), MG3 (p = 0.01), TS543 (p < 0.001), and KNS42 (p < 0.001) in control (black bars) and CMD treated cells after 24 h (gray bars), with 3 independent samples per group per cell line. Data is presented as mean ± SD. b Normalized metabolite concentrations for key metabolites validated with the standards downregulated in CMD versus control at 24 h, or (c) upregulated in CMD versus control at 24 h. d Normalized metabolite concentrations for key metabolites with internal standards downregulated in CMD versus control at 48 h, or (e) upregulated in CMD versus control at 48 h. b–e Log normalized values are shown, data for each condition is from 4 biological replicates. Statistics are assessed using two tail t-tests. Values are presented as mean ± SD. f–h Seahorse Mitochondrial stress test of MG3 cells in either control (black) or 12 h CMD (gray) OM: oligomycin, FCCP: Carbonyl cyanide-4 (trifluoromethoxy) phenylhydrazone, R/A: rotenone and antimycin A (n = 5). f The basal respiration, maximal respiration, ATP-linked respiration and proton leak values calculated from experiment in g were calculated and normalized (n = 5 per group). Data is presented as mean ± SD. h Extracellular acidification rate for control (black) or 12 h CMD (gray). Significance denoted by: *p < 0.05, **p < 0.01, ***p < 0.001.

