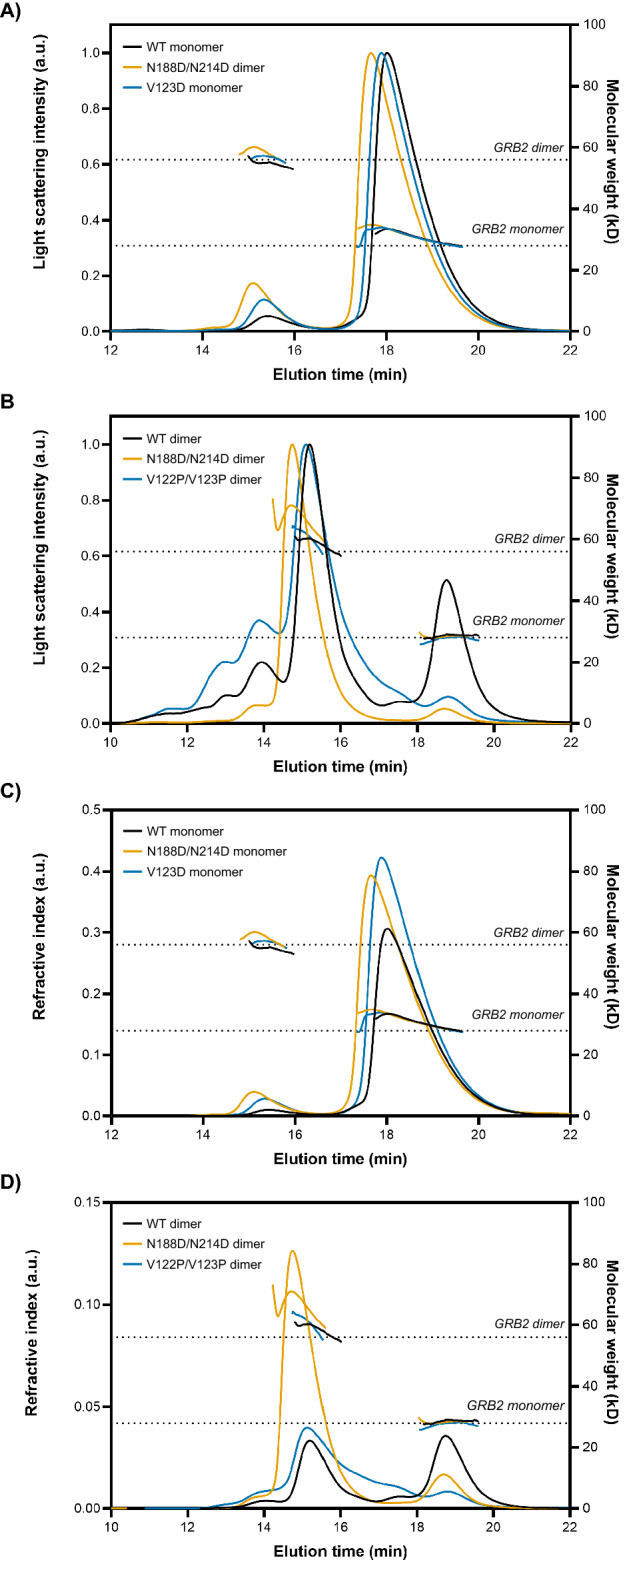
Figure 3.

SEC-MALS analysis of GRB2 mutants. Overlays of GRB2 WT, N188D/N214D, and V123D monomers are shown in black, orange, and blue, respectively, with (A) light scattering or (C) refractive index plotted against elution time. Overlays of GRB2 WT, N188D/N214D, and V122P/V123P dimers are shown in black, orange, and blue, respectively, with (B) light scattering or (D) refractive index plotted against elution time. Dashed lines denote the expected molecular weights of GRB2 monomer (~ 28 kDa) and dimer (~ 56 kDa).
