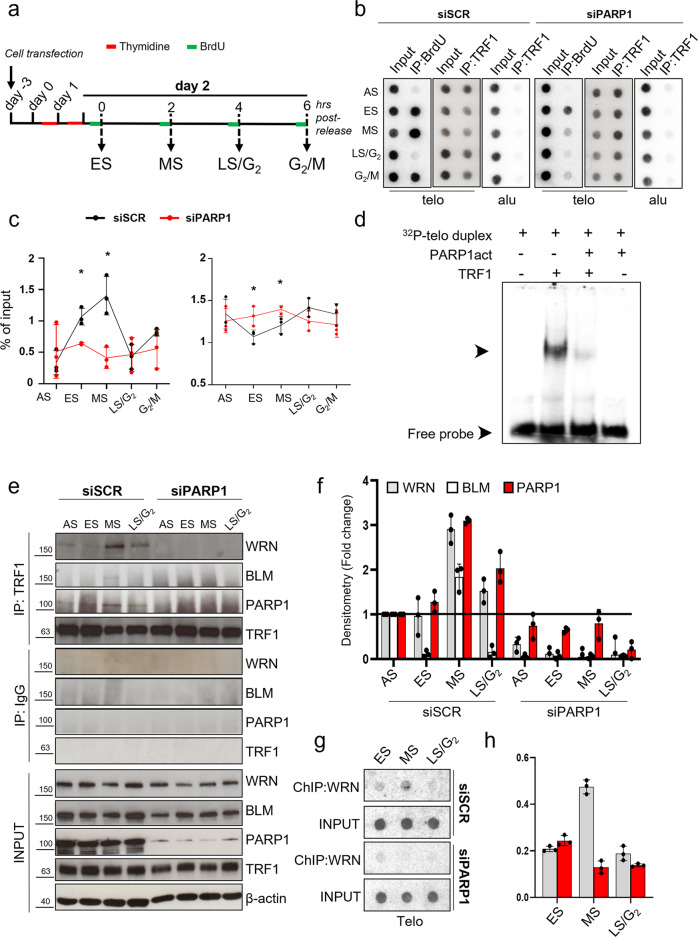
Fig. 3. PARP1 inhibition perturbs DNA synthesis and TRF1 dynamics at telomeres in S-phase.
HeLa cells were transfected with siSCR and siPARP1 RNAs, synchronized by double thymidine block and exposed to BrdU incorporation one hour before each endpoint (a). Samples were processed for ChIP against TRF1 or BrdU IP. Immunoprecipitated chromatin was dot blotted and hybridized with a radiolabeled probe against telomere repeats or Alu repeats (b). Immunoprecipitated samples signals were quantified by densitometry, and then reported as the percentage of immunoprecipitated chromatin on each respective input, Alu signals are shown as control of antibody specificity in TRF1 ChIP (c). One representative of three independent experiments with similar results is shown in the pictures in b, graphs in c report the mean of three independent experiments, bars are SD. d EMSA assay, radiolabeled telomeric DNA duplex was incubated with unmodified or PARP1-PARylated TRF1 and run-on nondenaturing polyacrylamide gel. Signals were acquired at the Phosphoimager. One of three independent experiments with similar results is shown, arrows indicate labelled DNA shift. e HeLa cells interfered for PARP1 and synchronized as above reported were immunoprecipitated against TRF1 and incubated with the indicated antibodies. Densitometry of immunoprecipitated proteins, normalized on each respective input and on the level of immunoprecipitated TRF1 is reported in the histogram as fold change with respect to AS sample. The histogram shows the mean of three independent experiments, bars are SD (f). The indicated samples, synchronized as in a, underwent ChIP against WRN. Immunoprecipitated chromatin was dot blotted and hybridized with a radiolabeled probe against telomere repeats or Alu repeats (g) Signals from ChIPed chromatin in each sample was quantified by densitometry and reported as percentage of each relative input (h). One representative of three independent experiments with similar results is shown. Graphs report the mean of three independent experiments, bars are SD.

