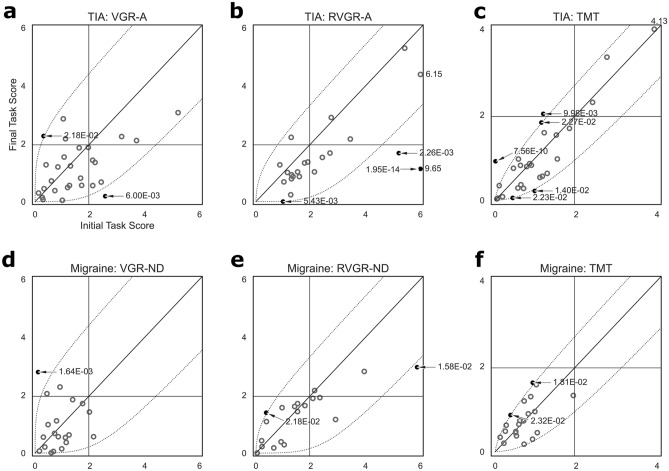
Figure 2.
Scatterplots of one-sided Task Scores at first- and second assessments in TIA (a–c) and migraine (d–f) cohorts. All: Horizontal and vertical dashed lines indicate impairment thresholds (1.96); diagonal lines indicate unity. Curved dashed lines indicate thresholds of significant change based on the expected change of healthy control participants, accounting for learning effects in RVGR-A/RVGR-ND and TM only. Values > 6 (VGR-A/VGR-ND, RVGR-A/RVGR-ND) or > 4 (TM) are marked on the plots (no arrows pointing at relevant datapoints). Individual significant change p-values are marked when changes were significant (arrows pointing at relevant datapoints). Open darker circles represent non-significant changes (i.e., within the curved boundaries), whereas filled circles represent significant changes (i.e., outside the curved boundaries). (a–c) Plots for TIA. (d–f) Plots for migraine.

