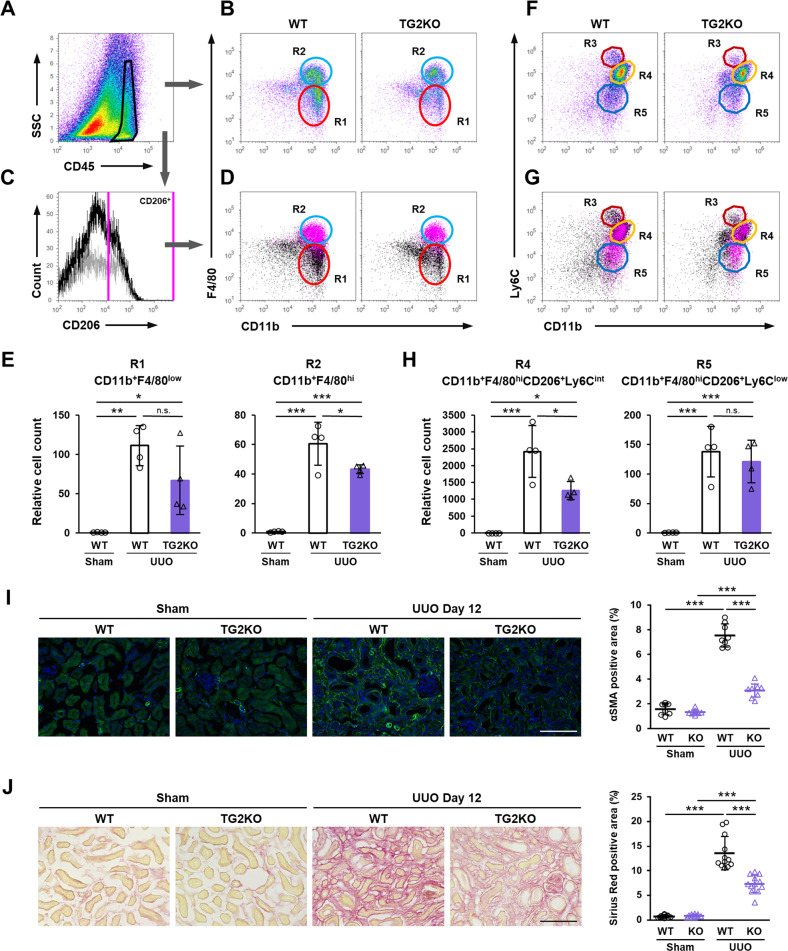
Fig. 2. Characterization of infiltrated macrophage into fibrotic kidney after UUO surgery.
CD45-positive cells from fibrotic kidney in WT and TG2KO mice were divided (A) into the CD11b+ F4/80low (R1) and CD11b+ F4/80hi (R2) groups (B). SSC side scatter. CD206-positive cells from WT (black) and TG2KO (gray) mice were selected in histogram plot (C) and colored with magenta in the dot plots shown in B (D). The relative cell counts of two groups were indicated (E). CD45-positive cells were also divided into the CD11b+ Ly6Chi (R3), CD11b+ Ly6Cint (R4), and CD11b+ Ly6Clow (R5) groups (F). CD206-positive cells were colored with magenta in the dot plots shown in F (G). The relative cell counts of R4 and R5 groups gated by both F4/80hi and CD206+ were indicated (H). Myofibroblasts in kidney sections were stained using anti-α-SMA antibody plus AlexaFluor 488 goat anti-rabbit IgG and the percentages of their positive area are presented (I). The nuclei were counterstained with DAPI. The collagen fibers in kidney sections were detected by picrosirius red staining and the percentages of their positive area are presented (J). Scale bars = 100 μm. Representative results in at least three independent samples were shown. (*P < 0.05, **P < 0.01, ***P < 0.001 by one-way ANOVA with post hoc Tukey’s multiple comparisons test).

