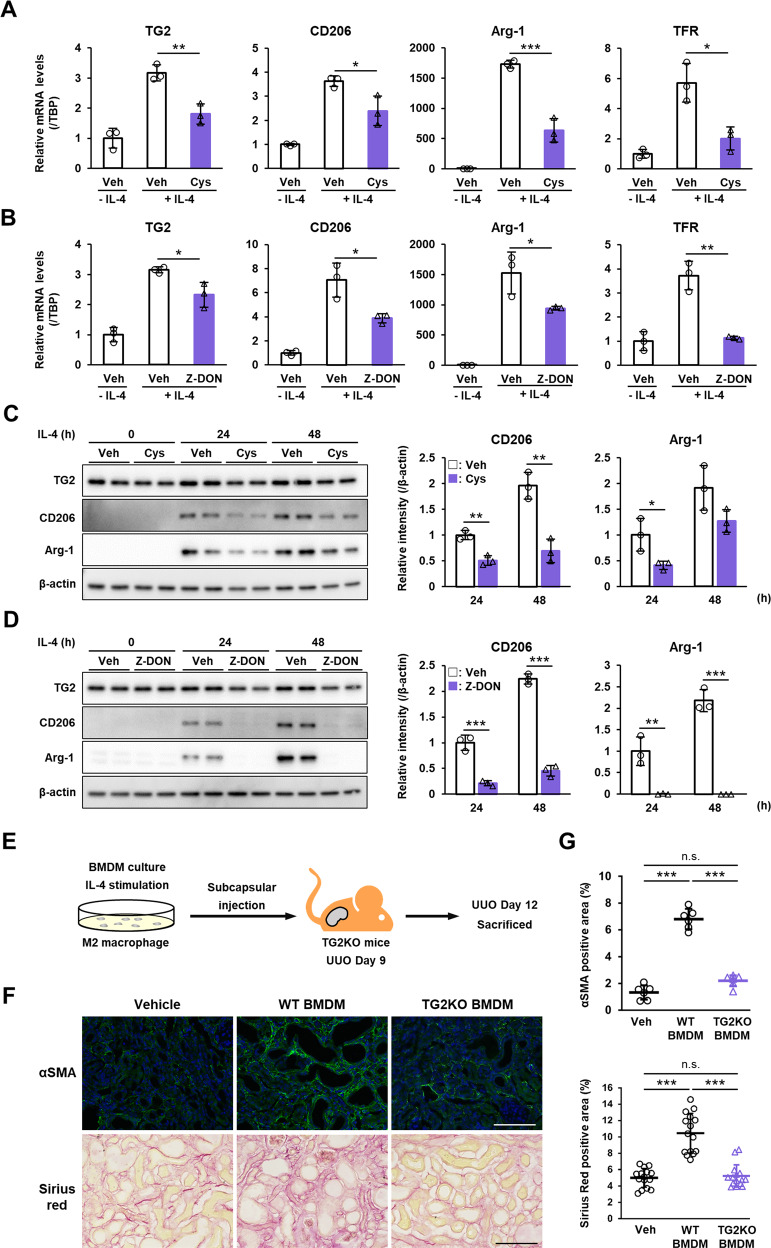
Fig. 4. Role of TG2 in M2 macrophage polarization induced by IL-4 and renal fibrosis.
BMDMs were prepared using bone marrow cells isolated from mice and cultured with L929 fibroblast conditioned medium. M2 macrophage polarization was induced by treatment of 20 ng/ml recombinant mouse IL-4 in the presence or absence of 0.4 mM cystamine and 50 μM Z-DON for 24–48 h. mRNA expression levels of TG2 and indicated mouse M2 macrophage markers were analyzed (A, B). Data were normalized against mRNA expression of TATA-binding protein (TBP) and relative values (a ratio of the control sample) were presented as the mean ± SD (n = 3) (**P < 0.01, *P < 0.05, Student’s t test). Veh Vehicle, Cys cystamine. The protein levels of these samples were analyzed by immunoblotting using the indicated antibodies (C, D). Anti-β-actin antibody was used as a loading control for each sample. Total intensities of all the bands in each sample were presented after normalizing the results to the expression levels in β-actin. The full-length blots with molecular mass markers are presented in Suppl. Figs. S2 and S3. BMDMs prepared from WT or TG2KO mice were treated by IL-4 for 2 h and transferred into renal subcapsule (4.75 × 10⁵ cells/mouse) of TG2KO mice on day 9 after UUO. These mice were sacrificed on day 12 after UUO and analyzed (E). The myofibroblasts and collagen fibers in kidney sections were detected by immunofluorescence staining using anti-α-SMA antibody and picrosirius red staining, respectively (F), and the percentages of their positive area are presented (G). The nuclei were counterstained with DAPI. Scale bars = 100 μm. Representative results in at least three independent samples were shown (***P < 0.001 by one-way ANOVA with post hoc Tukey’s multiple comparisons test).

