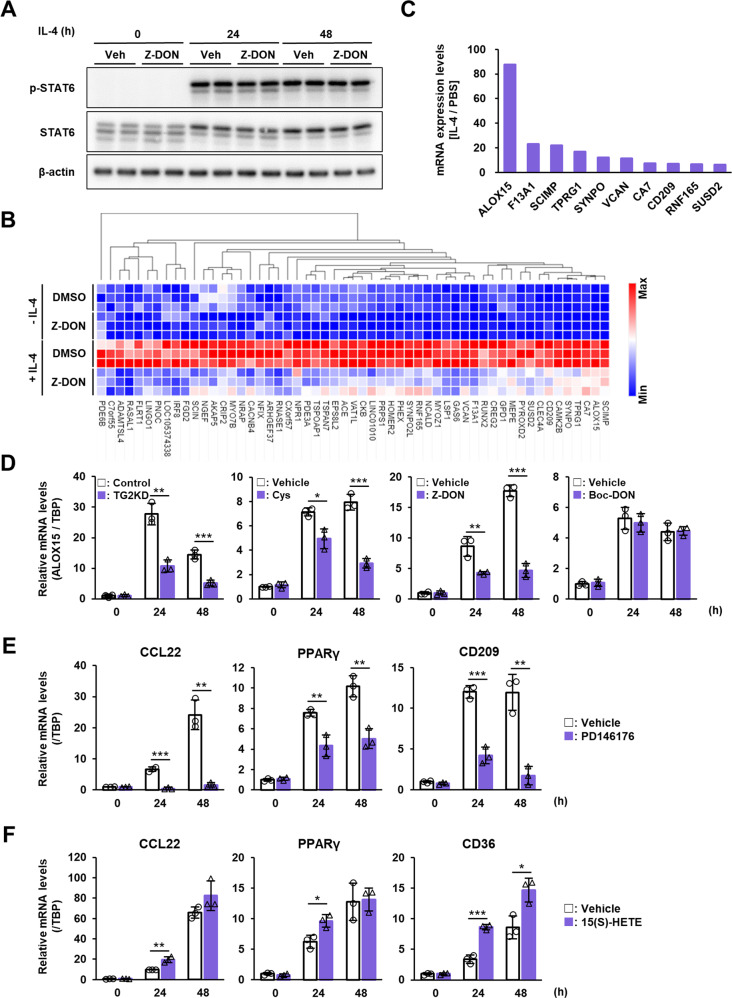
Fig. 7. Analysis of molecular mechanism of M2 macrophage polarization that is regulated by TG2.
Human macrophages differentiated from THP-1 were treated with 20 ng/ml IL-4 in the presence or absence of 50 μM Z-DON. Cells were extracted and analyzed by immunoblotting using the indicated antibodies (A). The full-length blots are presented in Suppl. Fig. S5. Total RNAs were conducted to transcriptome analysis as described in “Materials and methods” section. DGEs between vehicle- vs IL-4-treated samples (2-fold, FDR < 0.01) and between IL-4- vs IL-4 plus Z-DON samples (1.5-fold, FDR < 0.01) were determined. Among them, 55 genes that increase in TG2-dependent manner were identified and indicated as heat map (B). The relative means of the three groups of mRNAs whose expression was enhanced by IL-4 treatment among the 55 genes are plotted in ascending order (C). mRNA expression levels of ALOX15 were evaluated in the IL-4-treated human macrophages transfected with control and TG2 siRNA and treated with cystamine, Z-DON, and Boc-DON (D). mRNA expression levels of TG2 and indicated M2 macrophage markers were analyzed in IL-4-treated human macrophage combined treatment with 5 μM PD146176 (E) or 24 μM 15(S)-HETE (F). Data were normalized against mRNA expression of TBP and relative value were presented as the mean ± SD (n = 3) (***P < 0.001, **P < 0.01, *P < 0.05, Student’s t test).

