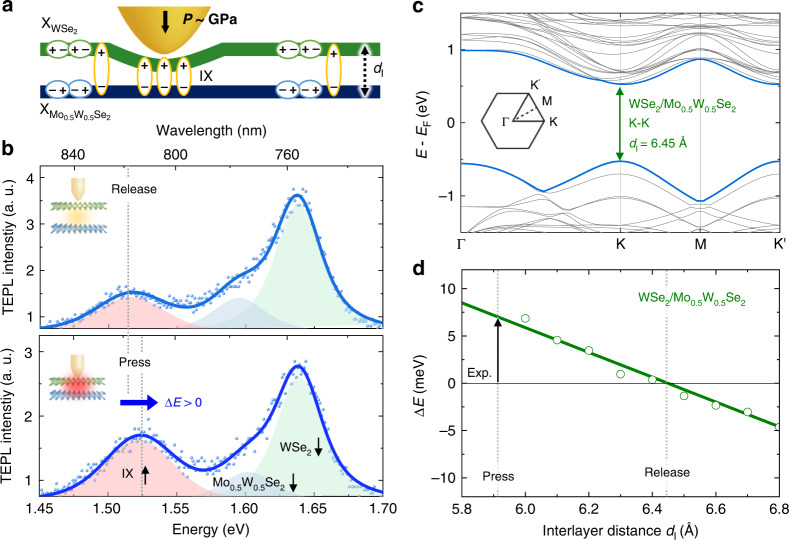
Fig. 3. Tip-induced control of interlayer coupling strength and simulated electronic bandstructures.
a Schematic illustration of the local tip control of the interlayer distance dI in a WSe2/Mo0.5W0.5Se2 heterobilayer. b TEPL spectra before (top) and after (bottom) pressing the heterobilayer with GPa scale tip-pressure, which causes significant modifications in electronic bandstructure. c Electronic bandstructure calculated via DFT for a WSe2/Mo0.5 W0.5 Se2 heterobilayer (gray) at equilibrium interlayer distance dI = 6.45 Å, with the highest valence and lowest conduction bands highlighted in blue; the direct K-K transition is indicated with green arrow; inset shows high-symmetry points in the hexagonal Brillouin zone. The Fermi energy EF is defined as an averaged energy of the conduction band minimum and the valence band maximum. d Calculated energy shift for the K-K transition in a WSe2/Mo0.5 W0.5 Se2 heterobilayer as a function of dI (green circles) and corresponding linear fit (green line), together with the experimentally measured tip-induced IX shift (black arrow)

