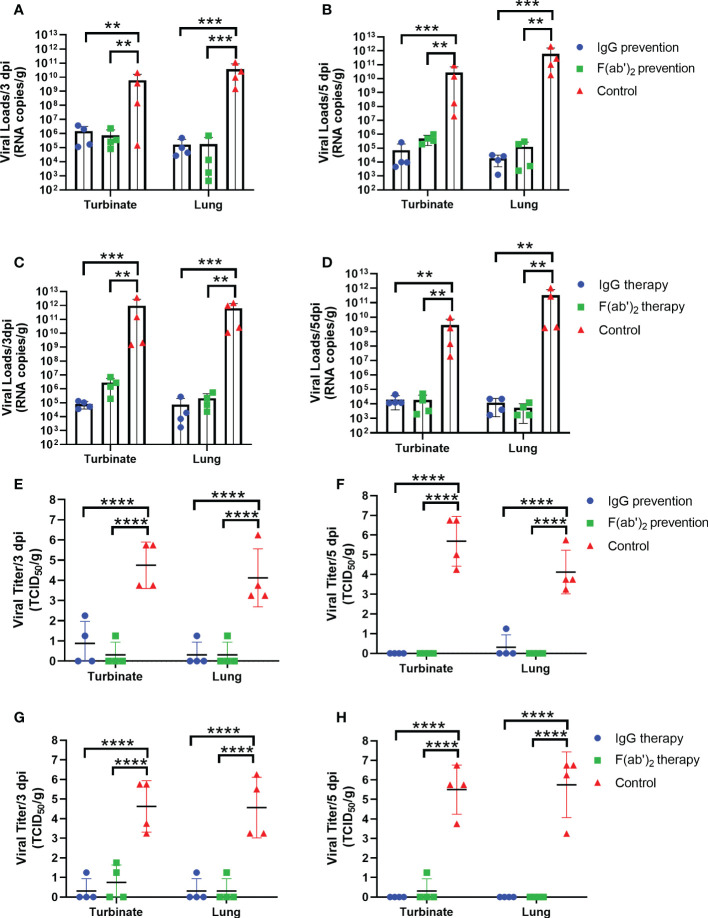
Figure 5.
Viral loads in the upper and lower respiratory tracts of mice. Four infected mice were sacrificed at 3 dpi and 5 dpi, respectively, and the turbinate and lungs were harvested to analyze the viral RNA loads by RT‒qPCR and TCID50. (A) The viral load quantified by RT‒qPCR at 3 dpi in the prevention group. (B) The viral load quantified by RT‒qPCR at 5 dpi in the prevention group. (C) The viral load quantified by RT‒qPCR at 3 dpi in the treatment group. (D) The viral load quantified by RT‒qPCR of the turbinate and lungs at 5 dpi in the treatment group. (E) The viral load confirmed by TCID50 at 3 dpi in the prevention group; (F) The viral load confirmed by TCID50 at 5 dpi in the prevention group; (G) The viral load confirmed by TCID50 at 3 dpi in the treatment group; (H) The viral load confirmed by TCID50 at 5 dpi in the treatment group. Data are presented as the mean ± SEM (n=4). (**P < 0.01, ***P < 0.001, ****P < 0.0001).

