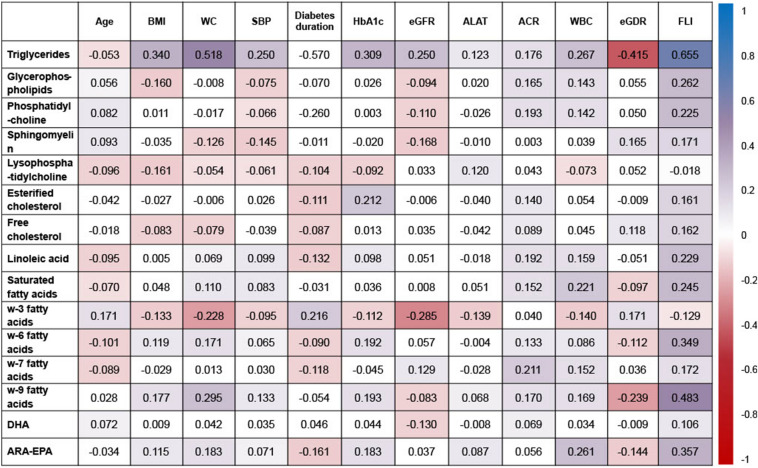
Fig. 1.
Associations between NMR lipidomics and clinical and laboratory parameters. Numbers in cells indicate Spearman’s R correlation index and the colour of each cell indicates the strength of association of that index according to the colour code shown in the right column. ACR albumin-to-creatinine ratio, ALAT alanine aminotransferase, BMI body mass index, eGDR estimated glucose disposal rate, eGFR estimated glomerular filtration rate, FLI fatty liver index, SBP systolic blood pressure, WBC white blood cells, WC waist circumference

