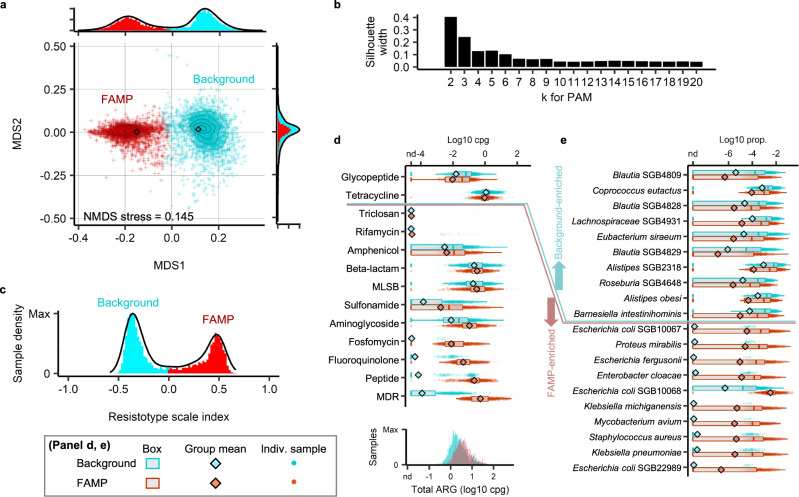
Fig. 3. Two distinct clusters apparent in the global landscape of adult gut resistome profiles.
a NMDS projection of Bray–Curtis dissimilarities among the log-transformed ARG family profiles (cpg) in adult gut metagenomes (contours estimate sample densities). Samples were colored by cluster assignment (PAM, Bray-Curtis clustering, k=2). b Average silhouette width of PAM Bray-Curtis clusters as a function of cluster number k. c Sample density projecting points onto the line joining cluster medoids using Bray–Curtis dissimilarities. d Box plots of the summed abundance of ARGs in each antibiotic class, separated by resistotype (`background' or `FAMP') with the distribution of total ARGs (cpg) by resistotype shown at the bottom. e Relative abundances of the ten species with highest mean fold difference between resistotypes and two-sided Mann–Whitney test, Benjamini–Hochberg-adjusted p < 0.05. Statistics on the differential abundance of ARG classes and the species between the two resistotypes are provided in Table S7. Results from clustering the ARG profiles with alternative methods and clustering of species compositions are given in Fig. S8. Comparison of species diversity and ARG diversity between the background and the FAMP resistotypes is provided in Fig. S5. Naming of the FAMP resistotype reflects the five antibiotic resistance classes enriched with the largest fold differences: F, fluoroquinolone and fosfomycin; A, aminoglycoside; M, multi-drug; P, peptide. Number of metagenome samples n = 3034 for the background resistotype, n = 2338 for the FAMP resistotype. In the box plots, the box spans from 25th to 75th percentiles, the line inside the box is the median, and the whisker spans from the minimum to the maximum values.

