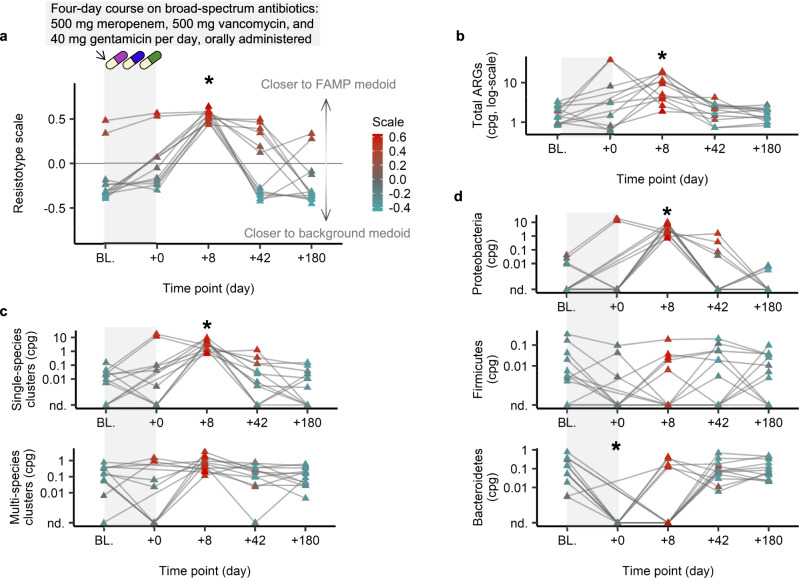
Fig. 6. Impact of short-term antibiotic consumption on resistotype assignment and total ARG abundance.
We present individual gut resistome trajectories during a course of antibiotic treatment in healthy individuals11. The subjects (n = 12) were orally administered 500 mg/day meropenem, 500 mg/day vancomycin, and 40 mg/day gentamicin for four days. a Resistotype scale index. b Total ARG abundance in normalized copies-per-genome (cpg). c Total ARG abundance in single-species or multi-species clusters (cpg). d Total ARG abundance across phyla based on taxonomic LCA (cpg). Resistotype scale index (a) and total ARG abundance (b) were calculated directly using our read-based approach. The ARG abundances stratified by cluster type (c) or taxonomic classification (d) were derived from the assembly-based analysis (see text). Data points were colored according to the resistotype scale (all panels). Significance compared to baseline computed with the two-sided paired Wilcoxon rank sum test, * Benjamini–Hochberg p < 0.05. Exact adjusted p-values for the significant case: resistotype scale at day 8, adjusted p = 0.0020 (a); total cpg at day 8, adjusted p = 0.0020 (b); single-species clusters cpg at day 8, adjusted p = 0.0038 (c); Proteobacteria ARGs cpg at day 8, adjusted p = 0.0038 (d); Bacteroidetes ARGs cpg at day 0, adjusted p = 0.039 (d). Samples from the same individual are connected by a gray line. Variation of resistotype frequencies by health condition, or by antibiotic exposure status, is provided in Fig. S11.

