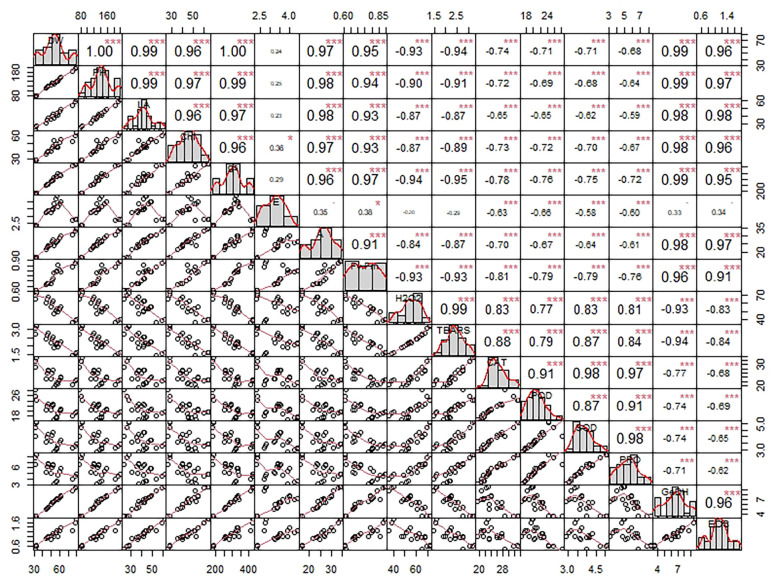
Figure 11.
Chart of correlation matrix exploring the intricate relation among variables using Pearson’s method. Each variable is distributed on the chart diagonal. The bottom of the diagonal corresponds to the bivariate scatter plot with a fitted line between any two variables. Further, each box in the diagonal top consists of the correlation values between any two variables and significance levels. Symbols denote significance levels following p-values: . (a = 0.01), * (a = 0.05), *** (a = 0.001). DW, dry weight; PH, plant height; LA, leaf area; CHL, chlorophyll content; gs, stomatal conductance; E, transpiration rate; A, photosynthetic carbon assimilation; Fv/Fm, chlorophyll fluorescence; H2O2, hydrogen peroxide content; TBARS, thiobarbituric acid reactive substances content; CAT, catalase activity; POD, peroxidase activity; SOD, superoxide dismutase activity; PRO, proline content; GeDH, geraniol dehydrogenase activity; EOC, essential oil content.

