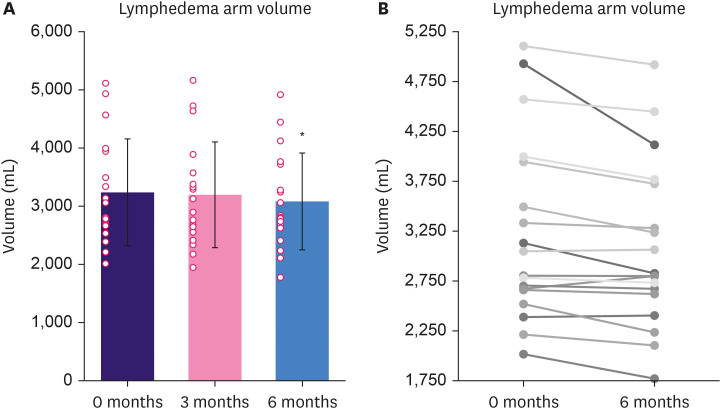
Figure 2. Change in arm volume from baseline to 6-month follow-up. Results are expressed as mean ± standard deviation and as individual datapoints. (A) Change in the mean volume of the BCRL arm in percent (%) from baseline (100.0%). (B) Individual change in BCRL arm volumes from baseline to 6-month follow-up.
BCRL = breast cancer-related lymphedema.
*p < 0.05 compared to baseline.

