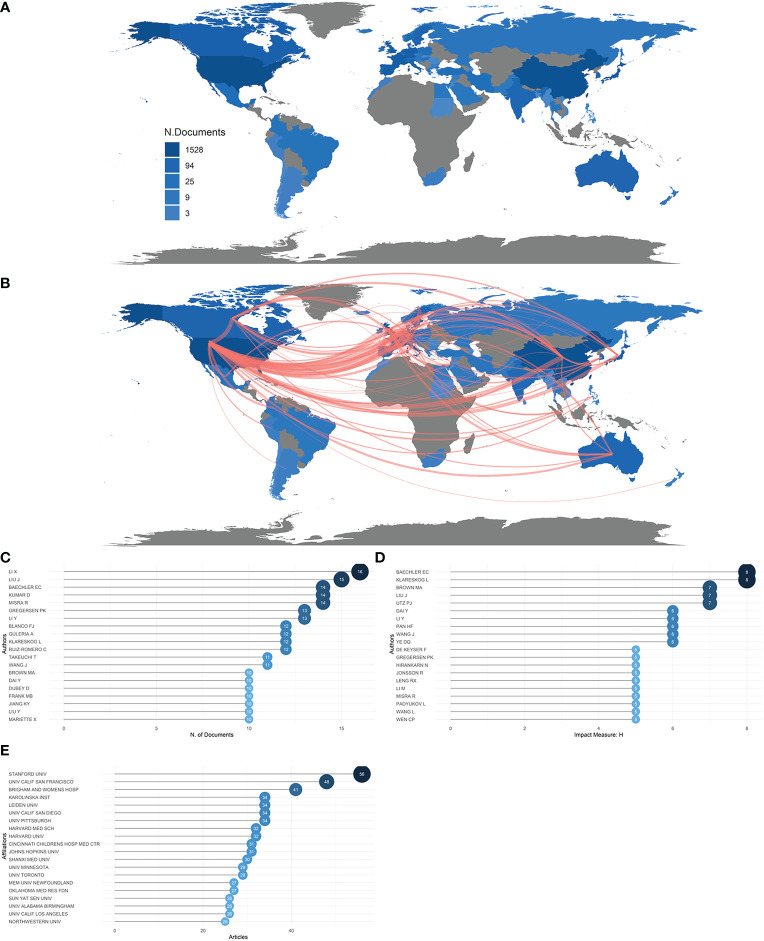
Figure 2.
Countries, authors, and institutions. (A) Country scientific production map. The darker the color, the greater the number of documents (frequency) published by a country or region. (B) Country collaboration map. Red lines represent the collaboration bonds between countries. The thicker the line, the stronger the collaboration between countries. (C) Most relevant authors in the field of rheumatism and sequencing. The size and darkness of the nodes are in proportion to the number of documents published by a particular author. (D) Most influential authors, as measured by the h-index. The size and darkness of the nodes are in proportion to the h-index for each author. (E) Most relevant affiliations in the field of rheumatism and sequencing. The size and darkness of the nodes are in proportion to the number of documents produced by the affiliation.

