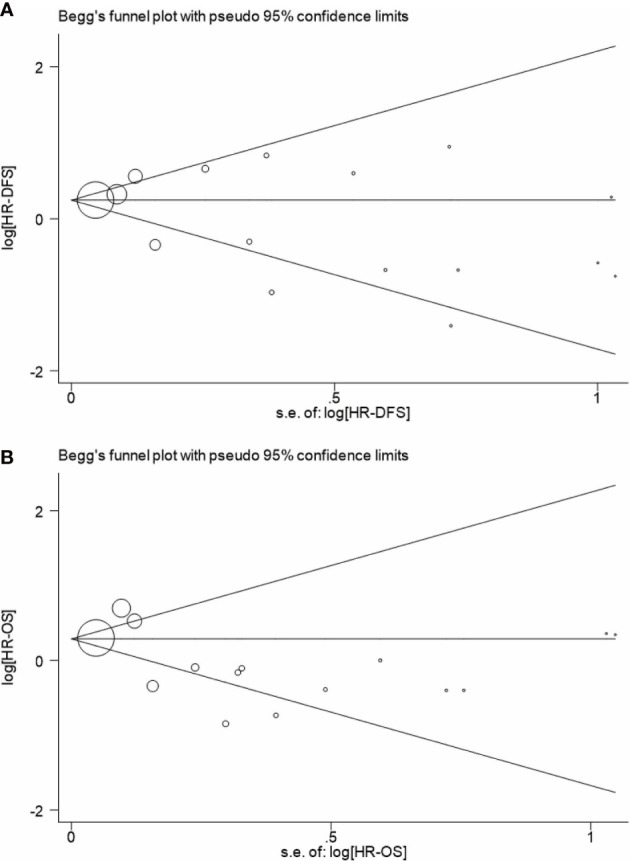
Figure 5.

Begg’s funnel plot for analyzing publication bias of DFS (A) and OS (B) in patients with AML. A circle represents a study, and the diameter of circle represents sample capacity. DFS, disease-free survival; OS, overall survival; AML, acute myeloid leukemia.
