Figure 2.
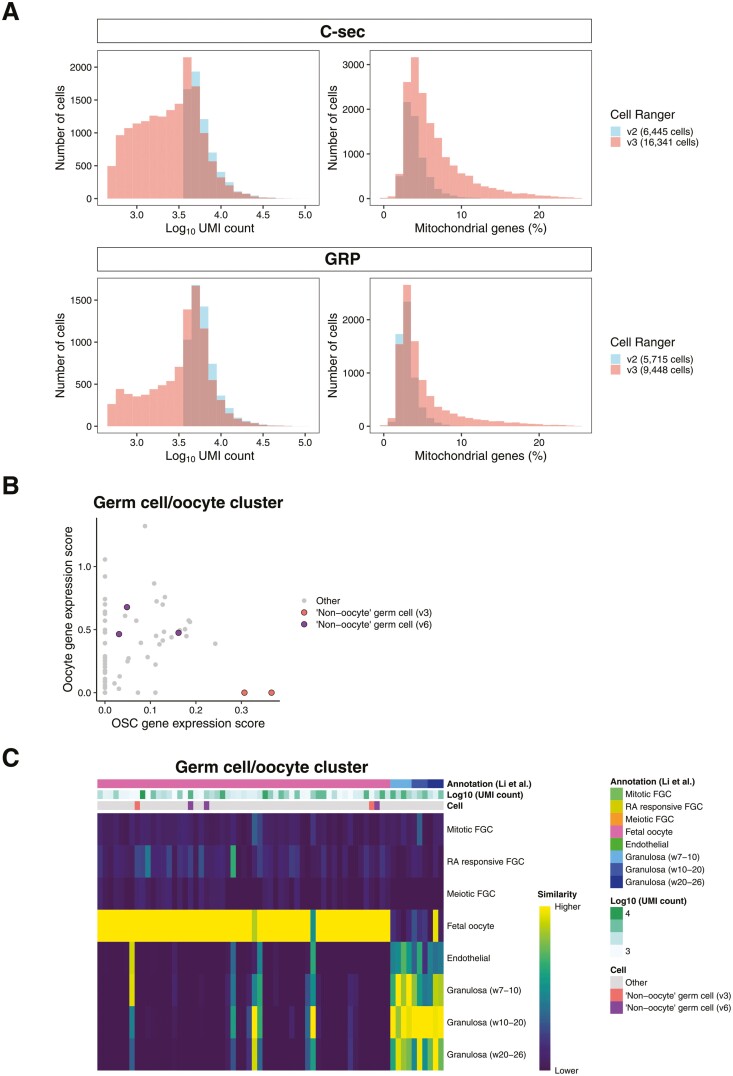
Comparison of scRNA-seq output using different versions of Cell Ranger. (A) Histogram showing the UMI counts per cell (left graphs) and percentage of mitochondrial genes per cell (right graphs) in Cell Ranger v2 and v3 outputs. Use of Cell Ranger v3 increased the number of cells with low UMI counts and with a higher percentage of mitochondrial genes when compared to v2. Blue: sequencing output using Cell Ranger v2, red: sequencing output using Cell Ranger v3. C-sec, caesarean section; GRP, gender reassignment patient. (B) Scatter plot of the germ cell cluster cells showing the oocyte (FIGLA, OOSP2, GDF9, and ZP3) and oogonial stem cell (PRDM1, DPPA3, and DAZL) marker expression scores based on Cell Ranger v6. The 3 non-oocyte germ cells/OSCs identified with the “optimized workflow” using Cell Ranger v6 are marked with purple, and the 2 identified by the Cell Ranger v3 analysis are marked with pink. (C) Heatmap showing the similarity of the cells in the germ cell cluster (analyzed by Cell Ranger v6) to female fetal gonadal cells. The cell identity assigned by SingleR, UMI counts, and cell identity suggested by Alberico et al. are shown. Similarity scale indicates the transcriptional similarity of annotated cells ranging from low (dark blue) to high similarity (yellow) to fetal germ and somatic cells. Abbreviation: FGC, fetal germ cell; RA retinoic acid.

