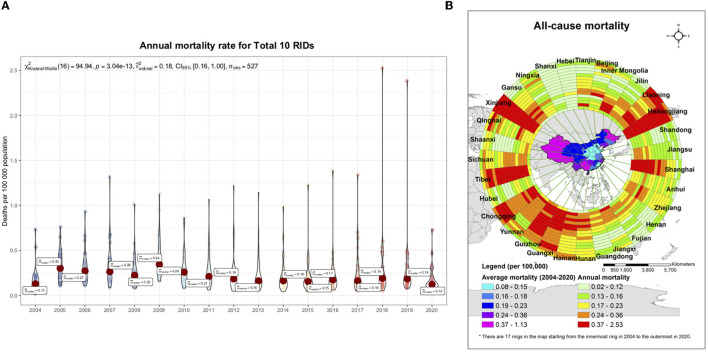
Figure 3.
Spatiotemporal distribution of mortality caused by 10 respiratory infectious diseases (RIDs) in 31 province-level units, from 2004 to 2020. (A) The epidemic trend for the annual mortality rate from overall respiratory infectious diseases in 31 province-level units, 2004–2020. The small, colored dots indicate the full range across all 31 provinces; and the big red dots indicate the average level. (B) The spatiotemporal clusters of overall respiratory infectious diseases. The mortality rate data for all 17 years and 31 provinces were used, with a maximum cluster population size of 10% to minimize false clusters and a maximum temporal window of 3 years to examine the clusters. The local risk ring maps were also done using ArcGIS software. The 14 rings contain data for each year studied, with the innermost ring bearing data for 2004, and moving outwards through the years to the outermost ring, bearing data for 2020.

