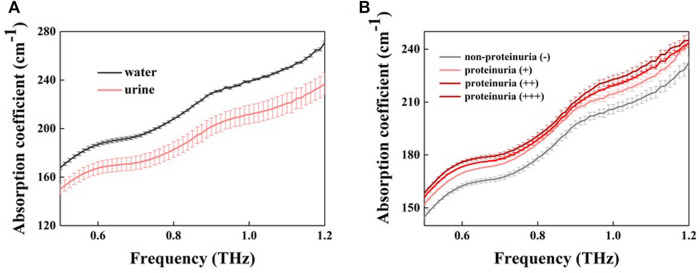
FIGURE 2.
The absorption coefficient of water and urine samples (A) Absorption coefficients for pure water (black line) and urine (red line) (B) THz absorption coefficients for different concentrations of proteinuria (different red lines) and non-proteinuria (grey lines). Error bars indicate the standard deviation.

