Figure 1.
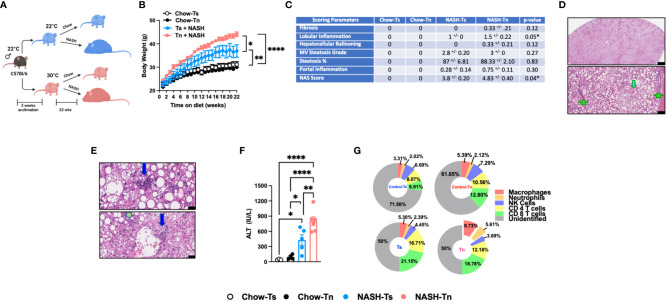
Tn housing augments NASH diet driven myeloid immune cell accrual in the liver and exacerbates liver disease pathogenesis. (A) Schematic of the experimental design. Eight-week-old WT mice maintained at Ts or acclimated to Tn for 2 weeks prior to study initiation were fed a chow (baseline reference) or NASH diet for 22 weeks. During the course of 22 weeks, (B) body weights of Ts and Tn housed mice were recorded. At the conclusion of the study, additional parameters of NAFLD severity were analyzed. (C) The liver tissue was preserved in formalin, stained with hematoxylin and eosin (H&E), and analyzed by a clinical pathologist. Table depicting histological scoring analyses for fibrosis, lobular inflammation, hepatocellular ballooning, macrovesicular (MV) steatosis grade, steatosis percentage, portal inflammation and NAFLD activity score (NAS) severity. (D) (Top) Extensive steatosis (80-95%) on H&E with a combination of classic large droplet macrovesicular steatosis (LD-MS) and small droplet (SD-MS) macrovesicular steatosis. (Portae: green arrows. Central veins: light blue arrows) (Top) Black bar = 629µm; (Bottom) Black bar = 109µm. (E) Liver H&E staining. (Top) Ballooning (yellow arrows), in a mixed patterned background with overlapping features, including SD-MS (light blue arrows) and LD-MS. Black bar = 25µm (Middle) Example for focal lobular inflammation (lymphocytic) (blue arrows), classic for NAFLD. Black bar = 25µm. (Bottom) Focal portal inflammation, perivenular (blue arrow), with small focus of cholangiolar reactivity (green arrow). Black bar = 33µm. (F) Hepatocellular damage as quantified by serum ALT levels collected at the conclusion of the study. (G) Hepatic inflammation as defined by flow cytometric analyses of hepatic immune cell accrual at the conclusion of the study. Donut charts depicting liver immune compositions (macrophages, neutrophils, CD4+ cells, CD8+ cells, NK cells, and unidentified cells) as determined by flow cytometry from percent of CD45+ population. In bar graphs, data represent mean +/- SEM. (B, C, F, G) Representative of 2 individual experiments (n=5-6/condition). (F) One-way ANOVA. *P<0.05, ** P<0.01, **** P<0.0001.

