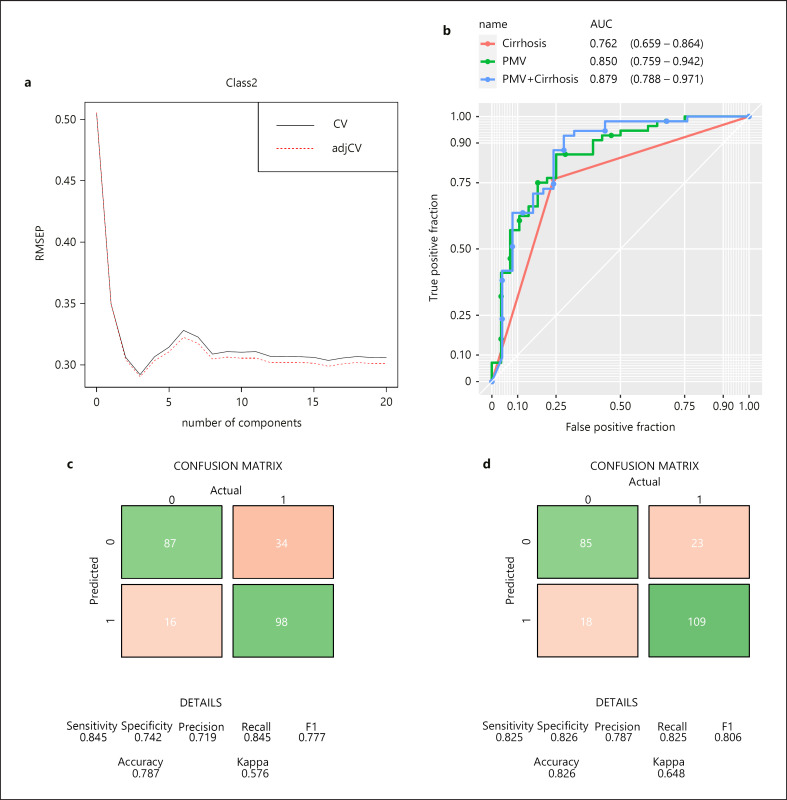
Fig. 1.
Building of predictive metabolite vector (PMV) to differentiate MAFLD from MAFLD-HCC. a Selection of optimal partial least squares regression (PLSR) model based on 21 metabolites. Root mean-squared error of prediction (RMSEP) (x-axis) is plotted against number of components (y-axis) after 10-fold cross-validation. Three components from PLSR are used to build PMV. Receiver operating characteristic (ROC) curves are plotted to demonstrate the predictive power of PMV and cirrhosis in the combined validation sets (b). Area under curve (AUC) values are shown under each plot. Confusion matrices summarizing the predicted HCC cases vs. actual HCC cases using models based on cirrhosis only (c) or PMV and cirrhosis (d) in the combined set.

