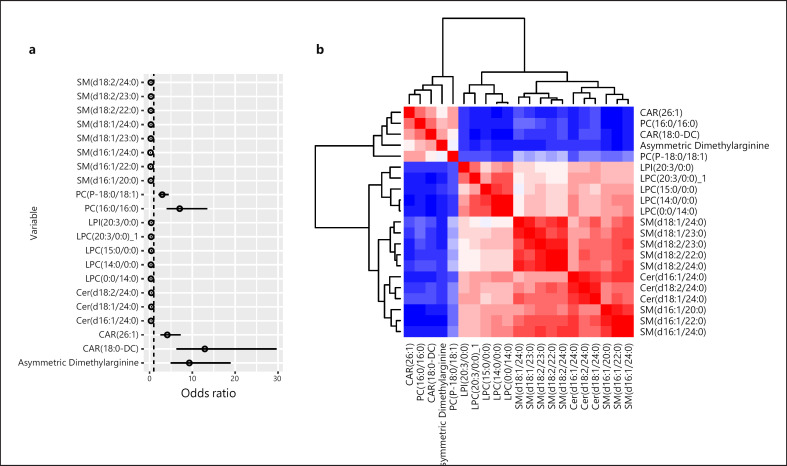
Fig. 2.
Inter-correlations among lipid species making up the PMV. a Forest plot analysis illustrating the association between the 21 metabolites and HCC. b Heatmap demonstrating the inter-metabolite correlations within the entire cohort. Red color indicates high similarity between the two species, whereas blue indicates low similarity.

