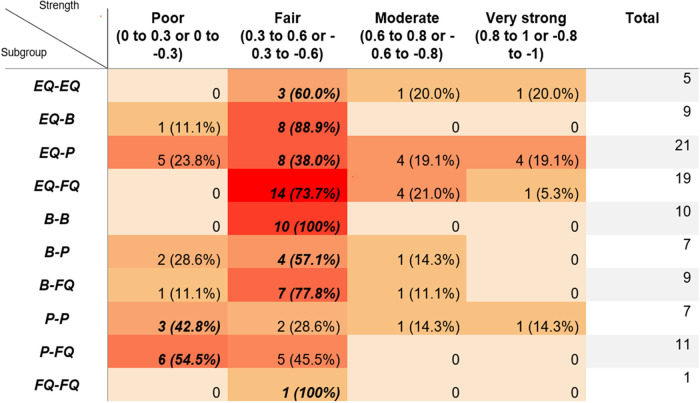
Table 1.
Showing the Number (%) of Each Classification Type Against Each Subgroup Comparison.
|
|
Overlaid with a heat map to illustrate the concentration of results. The model value for each subgroup comparison is indicated by bold and italicised text. (EQ = Effort Questionnaire, B = Behavioural Measures, P = Physiological Measures and FQ = Fatigue Questionnaire).

