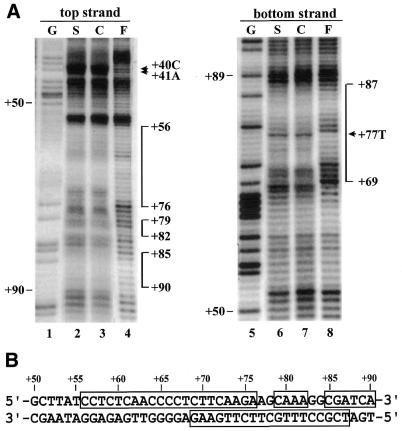
Figure 3.
Copper-phenanthroline footprinting analysis. (A) A DNA fragment covering +1 to +150 was 5′-end-labeled on either the top or bottom strand and incubated with rice shoot (S) or cell suspension (C) nuclear extracts. The mixture was resolved on a native polyacrylamide gel. DNA–protein complex C1 and free probe (F) were then digested in situ with 1,10-phenanthroline-copper ion. DNAs were eluted from the gel and resolved on a 6% polyacrylamide sequencing gel. A Maxam–Gilbert sequencing ladder (G) was run in parallel. The protected areas are depicted on the right of the gel by vertical bars. Numbers correspond to base pairs downstream of the transcription start site. The hypersensitive sites are indicated with arrowheads. (B) Nucleotide sequence of dps1 showing the areas protected in complex C1 (open boxes).

