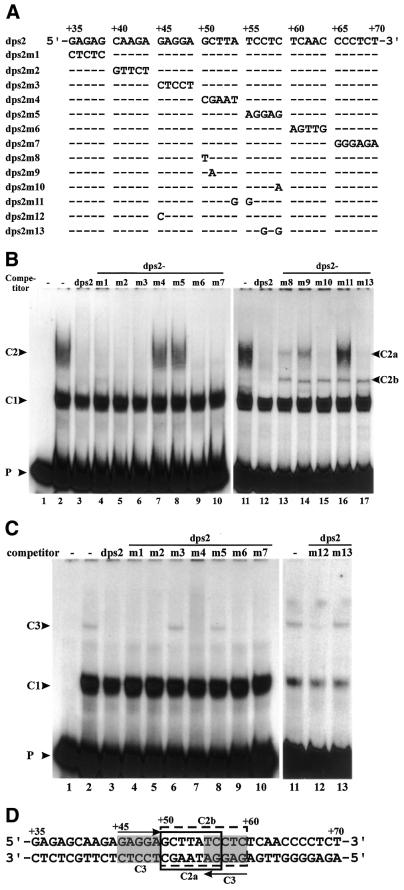
Figure 4.
Mutational analysis of the minimal binding sites of complexes C2 and C3 on dps2. (A) Wild-type dps2 and mutants used as competitors at a 200-fold molar excess in EMSAs. Dashes in the sequences indicate identity with the wild-type sequence. Only the mutated bases are indicated. (B) EMSAs were performed with labeled DNA probe from +1 to +90 in the absence (lane 1) or presence (lanes 2–17) of cell suspension nuclear extracts. Competitors used are indicated at the top of the gels. DNA–protein complexes are indicated. (C) EMSAs were performed as in (B) but with root nuclear extracts. (D) Nucleotide sequence of dps2. Open boxes with solid and dotted lines represent the binding sites of complexes C2a and C2b, respectively. Gray boxes indicate binding sites of complex C3. Arrows depict palindromic sequences.

