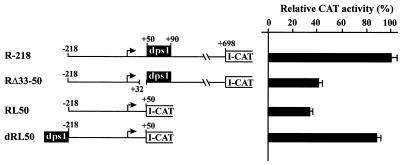
Figure 7.
Deletion analysis of the RTBV leader sequences. Constructs consisting of the RTBV upstream promoter sequence (to position –218) and the RTBV leader sequence (either complete or truncated as indicated) are shown schematically. All constructs were tested in transfected O.sativa protoplasts in at least three independent experiments. For each construct the mean promoter activity is indicated as a percentage of the activity of the wild-type construct R-218 (set as 100%).

