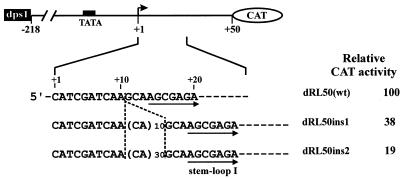
Figure 9.
Effect of the spacing between the initiation site and the GAGAG motif on promoter activity. A schematic representation of the constructs tested in transfected O.sativa protoplasts is shown at the top, with the expanded sequence underneath indicating insertions between +10 and +11. Inserted nucleotides are shown in parentheses. Corresponding CAT activities are shown on the left. The results shown are the average of at least three independent transient expression assays.

