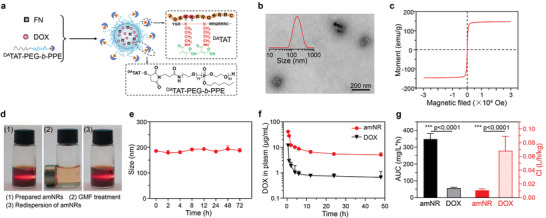
Figure 2.

Preparation and characterization of amNRs. a) Schematic illustrating the components of the amNRs. b) Representative TEM images and size distribution (inset) of the amNRs, demonstrating a size of ≈185 nm. c) Magnetization curve of the amNRs. d) Orientational actuation and redispersion of prepared amNRs under GMF. The solutions were irradiated by a light beam to show the Tyndall scatter phenomenon. e) Changes in amNR size in culture medium containing 10% FBS. f) Plasma pharmacokinetic curves of amNR and DOX after intravenous injection (n = 3). g) The key pharmacokinetic parameters AUC and Cl of amNR and DOX. Data are shown as mean ± S.D. n = 3. ***p < 0.001.
