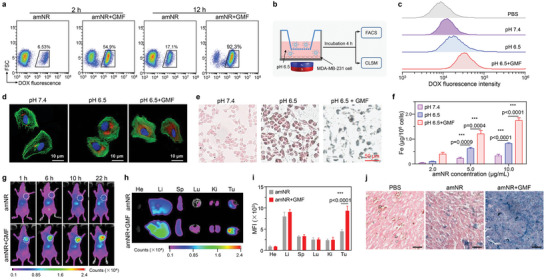
Figure 4.

The acidic microenvironment of deep tumor tissue uncovered the masked TAT ligand on the amNRs for active tumor cell uptake. a) Flow cytometry analysis of the percentages of DOX‐positive MDA‐MB‐231/GFP cells at 2 and 12 h postinjection of amNRs. b) Schematic illustration of the cellular uptake of amNRs under a GMF at pH 6.5 in the Transwell system. c,d) Flow cytometry analysis (c) and CLSM images (d) of MDA‐MB‐231 cell uptake of amNRs at pH 6.5 under a GMF. Coincubation of MDA‐MB‐231 cells and amNRs at pH 6.5 and pH 7.4 were used as controls. e) Cellular uptake of amNRs investigations using nuclear fast red and Prussian blue double‐staining. f) Inductively coupled plasma‐mass spectrometry (ICP‐MS) analysis of Fe content in MDA‐MB‐231 cells under the treatments shown in (b) Data are shown as mean ± S.D. n = 3. One‐way ANOVA with a Tukey post hoc test. ***p < 0.001. g) In vivo distribution of DiD‐labeled amNRs after intravenous injection with or without GMF application. h) Representative ex vivo imaging of the major organs (He: heart, Li: liver, Sp: spleen, Lu: lung, and Ki: kidney) and tumor (Tu) tissues after administration of amNRs 24 h. i) Region of interest (ROI) analysis of the fluorescence signals in the collected tissue in (h). Data are presented as the mean ± S.D. n = 3. Student's t‐test. ***p < 0.001. j) Distribution and accumulation of amNRs in the tumors determined by Prussian blue staining at 24 h postinjection (scale bar, 50 µm).
