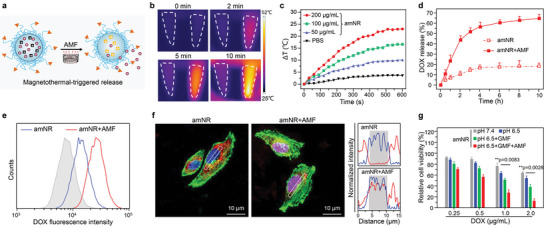
Figure 5.

The amNRs exhibit active DOX release after AMF treatment. a) Schematic illustration of active DOX release from the amNRs via AMF‐mediated heat generation. b) Thermographic maps of the centrifuge tubes containing PBS (1 mL, left) or amNRs (1 mL, [Fe] = 100 µg mL−1, right) subjected to AMF (25 kA m−1, 317 kHz). c) Time‐dependent temperature change curves of amNRs ([Fe] = 200, 100, 50 µg mL−1) under an AMF for 10 min. d) DOX release profiles from amNRs with or without AMF treatment. Data are presented as the mean ± S.D. (n = 3). e) Flow cytometric analyses of MDA‐MB‐231 cells after AMF treatment and further incubation for 4 h. The MDA‐MB‐231 cells were precultured with amNR for 4 h. f) CLSM images of intracellular release in the Transwell system (e) for 4 h followed by treatment with an AMF (25 kA m−1, 317 kHz) for 10 min. The colocalization of amNRs (red line) with the nucleus (blue line) is shown in the right section. g) Viability of MDA‐MB‐231 cells after incubation with amNRs in the Transwell system (e) under different conditions. Data are presented as the mean ± S.D. (n = 3). One‐way ANOVA with a Tukey post hoc test was performed in (g). **p < 0.01.
