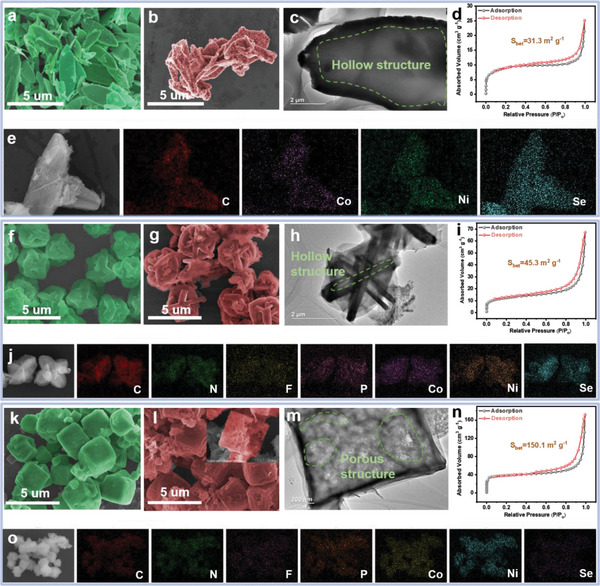
Figure 2.

Scanning electron microscopy (SEM) images of a) Co‐Ni‐MOF‐0 (in green false color) and b) CoSe2‐NiSe2/C (in red false color). c) Transmission electron microscopy (TEM) image, d) Brunauer–Emmett–Teller (BET) data, and e) elemental mapping results of CoSe2‐NiSe2/C. SEM images of f) Co‐Ni‐MOF‐0.1 and g) CoSe2‐NiSe2/NPFC‐0.1. h) TEM image, i) BET data, and j) elemental mapping results of CoSe2‐NiSe2/NPFC‐0.1. SEM images of k) Co‐Ni‐MOF‐0.2 and l) CoSe2‐NiSe2/NPFC. m) TEM image, n) BET data, and o) elemental mapping results of CoSe2‐NiSe2/NPFC.
