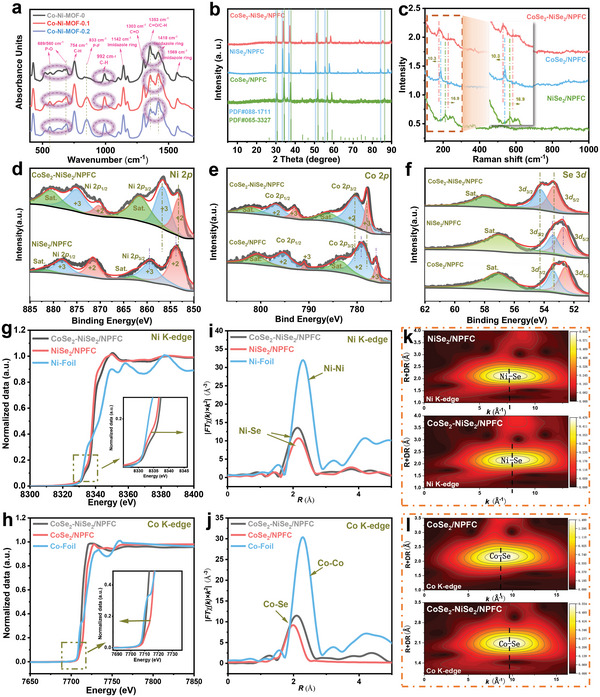
Figure 3.

a) FT‐IR spectra of Co‐Ni‐MOF‐0, Co‐Ni‐MOF‐0.1, and Co‐Ni‐MOF‐0.2. b) X‐ray diffraction (XRD) patterns and c) Raman spectra of CoSe2‐NiSe2/NPFC, CoSe2/NPFC, and NiSe2/NPFC. XPS peaks of d) Ni 2p, e) Co 2p, and f) Se 3d for CoSe2‐NiSe2/NPFC, NiSe2/NPFC, and Ni foil. XANES spectra at the g) Ni K‐edge and h) Co K‐edge for CoSe2‐NiSe2/NPFC and other materials. The corresponding FT EXAFS data at the i) Ni K‐edge and j) Co K‐edge for CoSe2‐NiSe2/NPFC and other materials. WT EXAFS plots at the k) Ni K‐edge and l) Co K‐edge for CoSe2‐NiSe2/NPFC and other materials.
