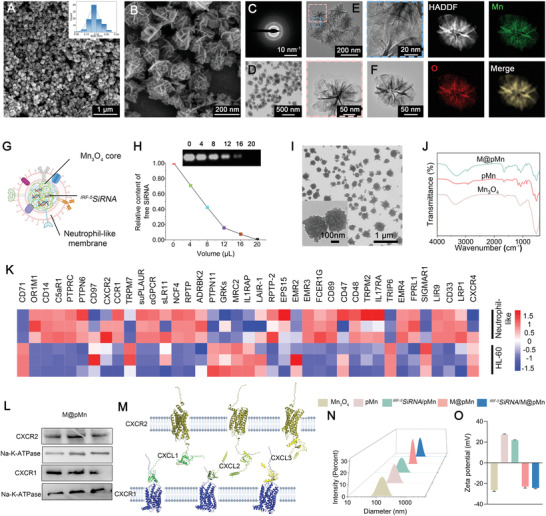
Figure 1.

Preparation and characterization of IRF‐5SiRNA/M@pMn. A,B) SEM, C) SAED patterns, D) TEM, and E,F) HAADF‐STEM images with the corresponding elemental mappings of Mn3O4. G) Schematic illustration of IRF‐5SiRNA/M@pMn particles. H) Characterization of pMn/SiRNA nanoparticles using agarose gel electrophoresis at the different volumes of siRNA (0, 4, 8, 12, 16, and 20 µL of 20 µM siRNA) with 2 µL of 1 mg mL−1 pMn. I) TEM images of IRF‐5SiRNA/M@pMn. J) FTIR spectra of Mn3O4, pMn, and M@pMn nanoparticles. K) Heatmap of membrane protein expression in HL‐60 and neutrophil‐like cells. L) Western blots of CXCR1/2 protein levels in M@pMn. Three lanes in this western blot image reflect triplicate tests. M) Computer simulation image of protein docking between CXCR1/2 and CXCL1/2/3. N) Diameter and O) zeta potential of the different nanoparticles (n = 3). Data are presented as mean ± SD. Statistical analysis was performed using a one‐way ANOVA followed by Tukey's post hoc test, *p < 0.05; **p < 0.01; ***p < 0.001; ns, no statistical significance.
