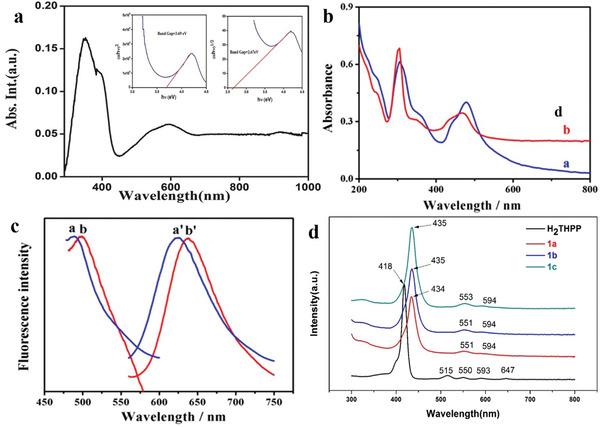
Figure 16.

a) Absorption spectrum of materials made using Tauc's plots (inset). Reproduced with permission.[ 189 ] Copyright 2015, Royal Society of Chemistry. b) UV–Vis absorption spectrum of a) Ru‐MOFNSs and b) Ru(dcbpy)3 2+. c) Fluorescence incentive and shot spectra of a,aʹ) Ru(dcbpy)3 2+ and b,bʹ) Ru‐MOFNSs. Reproduced with permission.[ 191 ] Copyright 2019, John Wiley. (d) UV–Vis absorption spectra for ligand and 1a–c. Reproduced with permission.[ 192 ] Copyright 2019, Royal Society of Chemistry.
