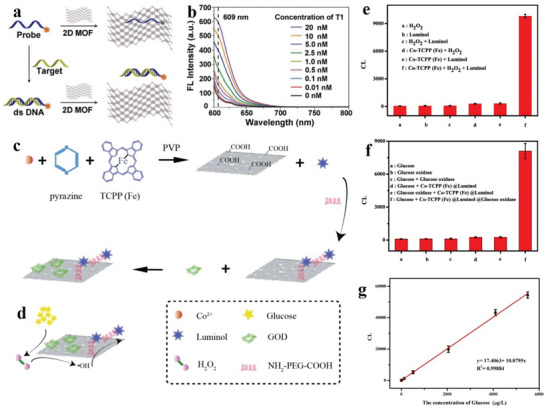
Figure 32.

a) Schematic explanation of splendent DNA sensor. b) Scope of DNA investigation with accretion of disparate concentrations of objective DNA (T1). Reproduced with permission.[ 256 ] Copyright 2015, Wiley‐VCH. c) Course preparation of CL sensor. d) Glucose detection method. (e) Photic properties of Co‐TCPP(Fe)@luminol. f) Photic properties Co‐TCPP(Fe)@luminol@GOD. g) Standard curve of CL and glucose concentration. Error bars manifest the normal difference of three repetitions. Reproduced with permission.[ 257 ] Copyright 2019, American Chemical Society.
