Figure 1.

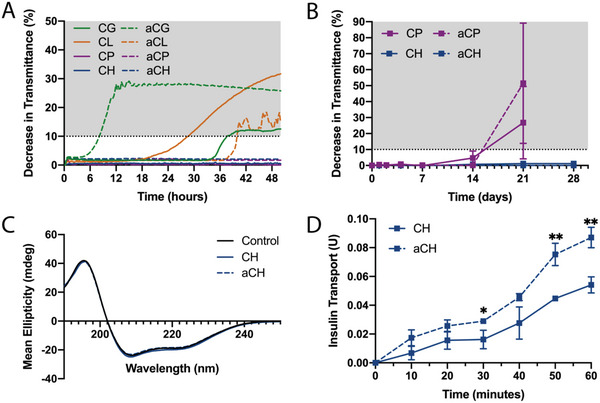
Determination of SPADE formulation. A) Average decrease in transmittance of insulin‐DES formulations stored at 37 °C with continuous shaking for 50 h. The shaded gray represents the region in which formulations were considered unstable (n = 3). B) Average decrease in transmittance of insulin‐DES formulations that were stable in (A) stored at 4 °C for 28 days. The shaded gray represents the region in which formulations were considered unstable (n = 3). C) Circular dichroism for insulin‐DES formulations that were stable in (B) compared to the fresh, stable insulin control (n = 5). D) Insulin transport across HUVEC monolayer on transwell cell culture inserts (n = 3). Data plotted as mean ± standard deviation (SD) and statistical significance was determined with a t‐test. *p < 0.05, **p < 0.01.
