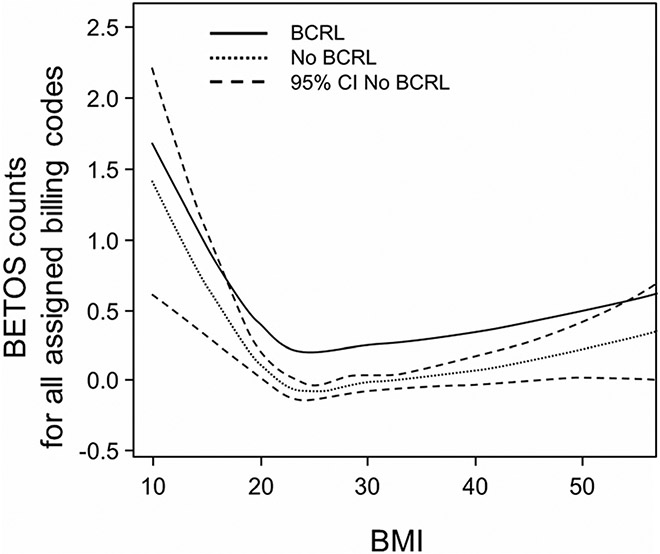
Fig. 2.
The line graph plots BMI against total BETOS counts per year of survivorship. The parallel slopes of the BCRL(+) and BCRL(−) lines to the right and left of BMI = 22 indicate the absences of an interaction between BMI and BCRL status. The dotted lines represent the confidence interval for the BCRL(−) line

